
<img height="1" width="1" style="display:none" src="https://www.facebook.com/tr?id=4246513698961258&amp;ev=PageView&amp;noscript=1">
The Content Coverage Heatmap

See your content coverage on a living map.

See which buyers your content actually covers, by segment, by persona, by stage, within your revenue plan. Then see how your coverage compares to the competitors chasing the same buyers.

Get your coverage score →
41%
Coverage score
Your revenue plan
$13.2M
revenue exposed
AWARECONSIDERSELECTCOMMIT
SaaS Tech4321
FinTech31
Health Tech21
Pro Svcs321

You can count your content.
You can't tell if it covers your revenue plan.

Your revenue plan expects marketing-driven pipeline from specific segments, personas, and stages. Most teams can say what they've published. Few can say whether it covers those exact buyers.

Sellers feel the gaps first, walking into deals marketing never covered, against competitors who did.
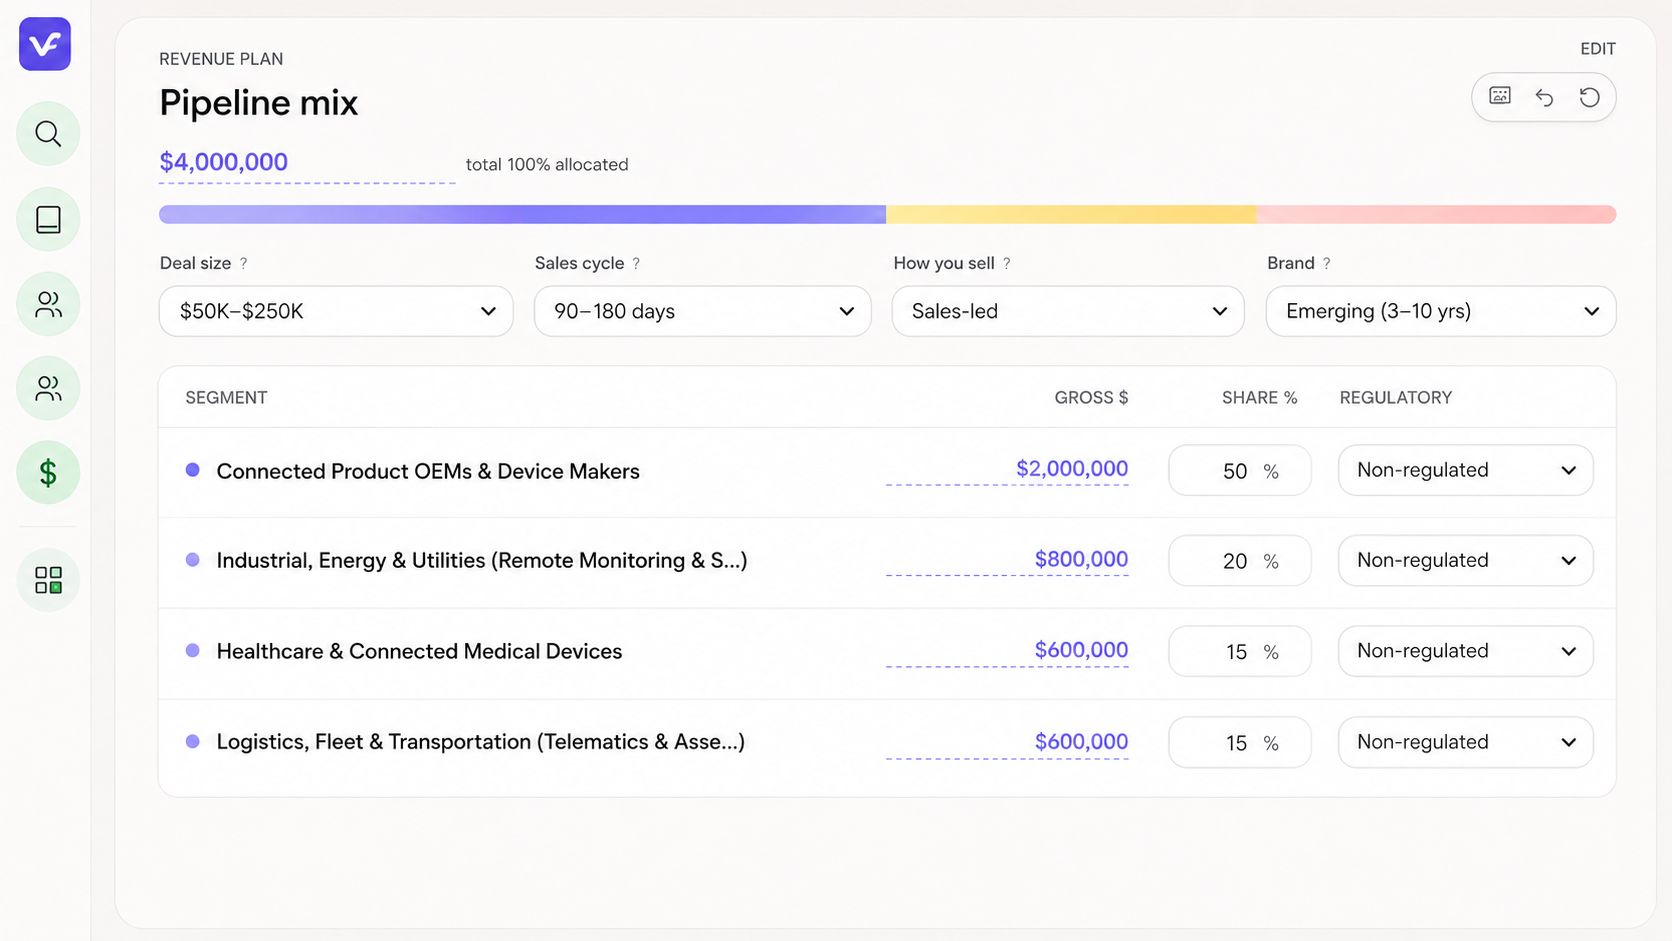
pipeline-mix-1

What full coverage takes

10
segments
×
5
personas
×
3
journey stages
=
150
tailored assets, at minimum
Most teams sit at 20%
How it works

One map, from your content to your number.

Scans your content

Point it at your site and it reads your existing material and places it on the map for you, no manual audit or spreadsheet.

Infers your buying committee

For every segment you sell into, it maps the personas, buyer roles, and jobs to be done. You confirm or adjust before anything gets scored.

Scores it against the plan

Every asset is scored against the personas, segments, and stages in your revenue plan, so you see real coverage, not a page count.

What you get

A Coverage Score, and the gaps behind it.

A single score showing how much of your revenue plan your content covers today, and the intelligence driven map underneath it to see exactly where you're exposed.
Your Coverage Score: One number for how much of your revenue plan your content covers.
Gaps ranked by pipeline: So you know what to close first, weighted by your own plan.
The buyers nobody has covered: Down to the persona, at every journey stage.
One shared view: Sales and marketing see the same coverage, scored against the plan they're both selling.
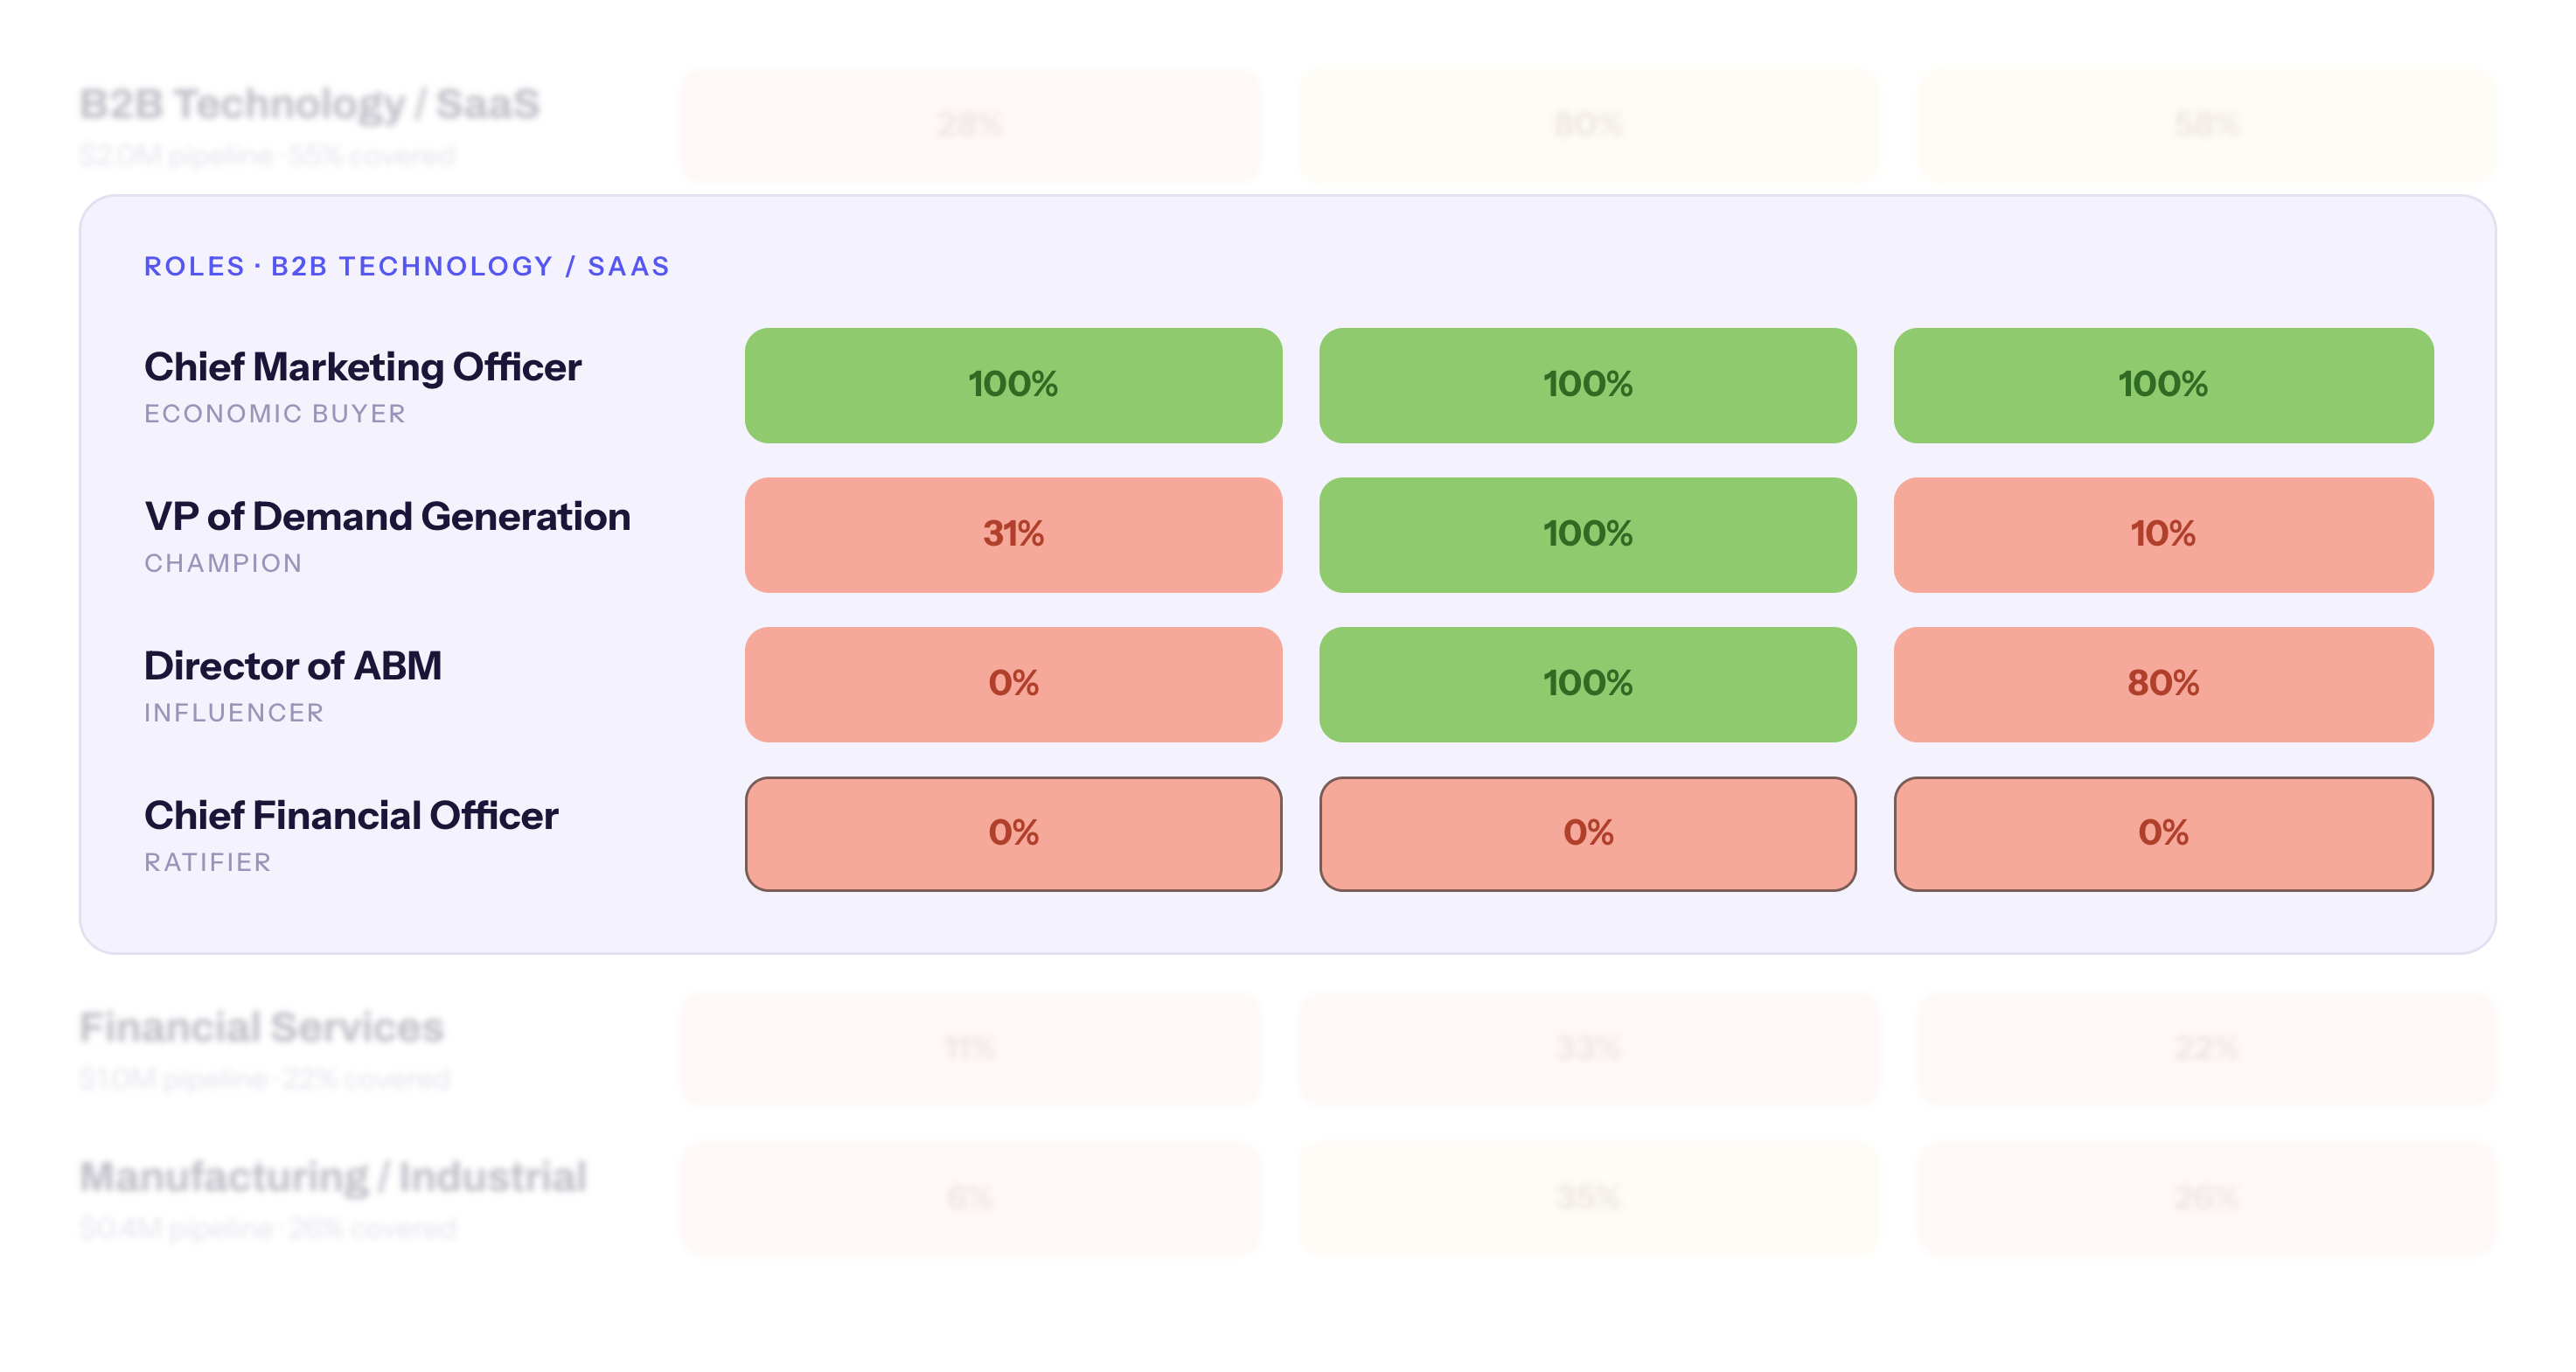
roles-drilldown
!
Action signal

The CFO signs off on the purchase, and reads nothing. 0% at every stage is the clearest place to build next.

No black box

Every cell shows its work.

Open any cell to see the assets behind it, ranked by how well they match that buyer and how recently they were published.
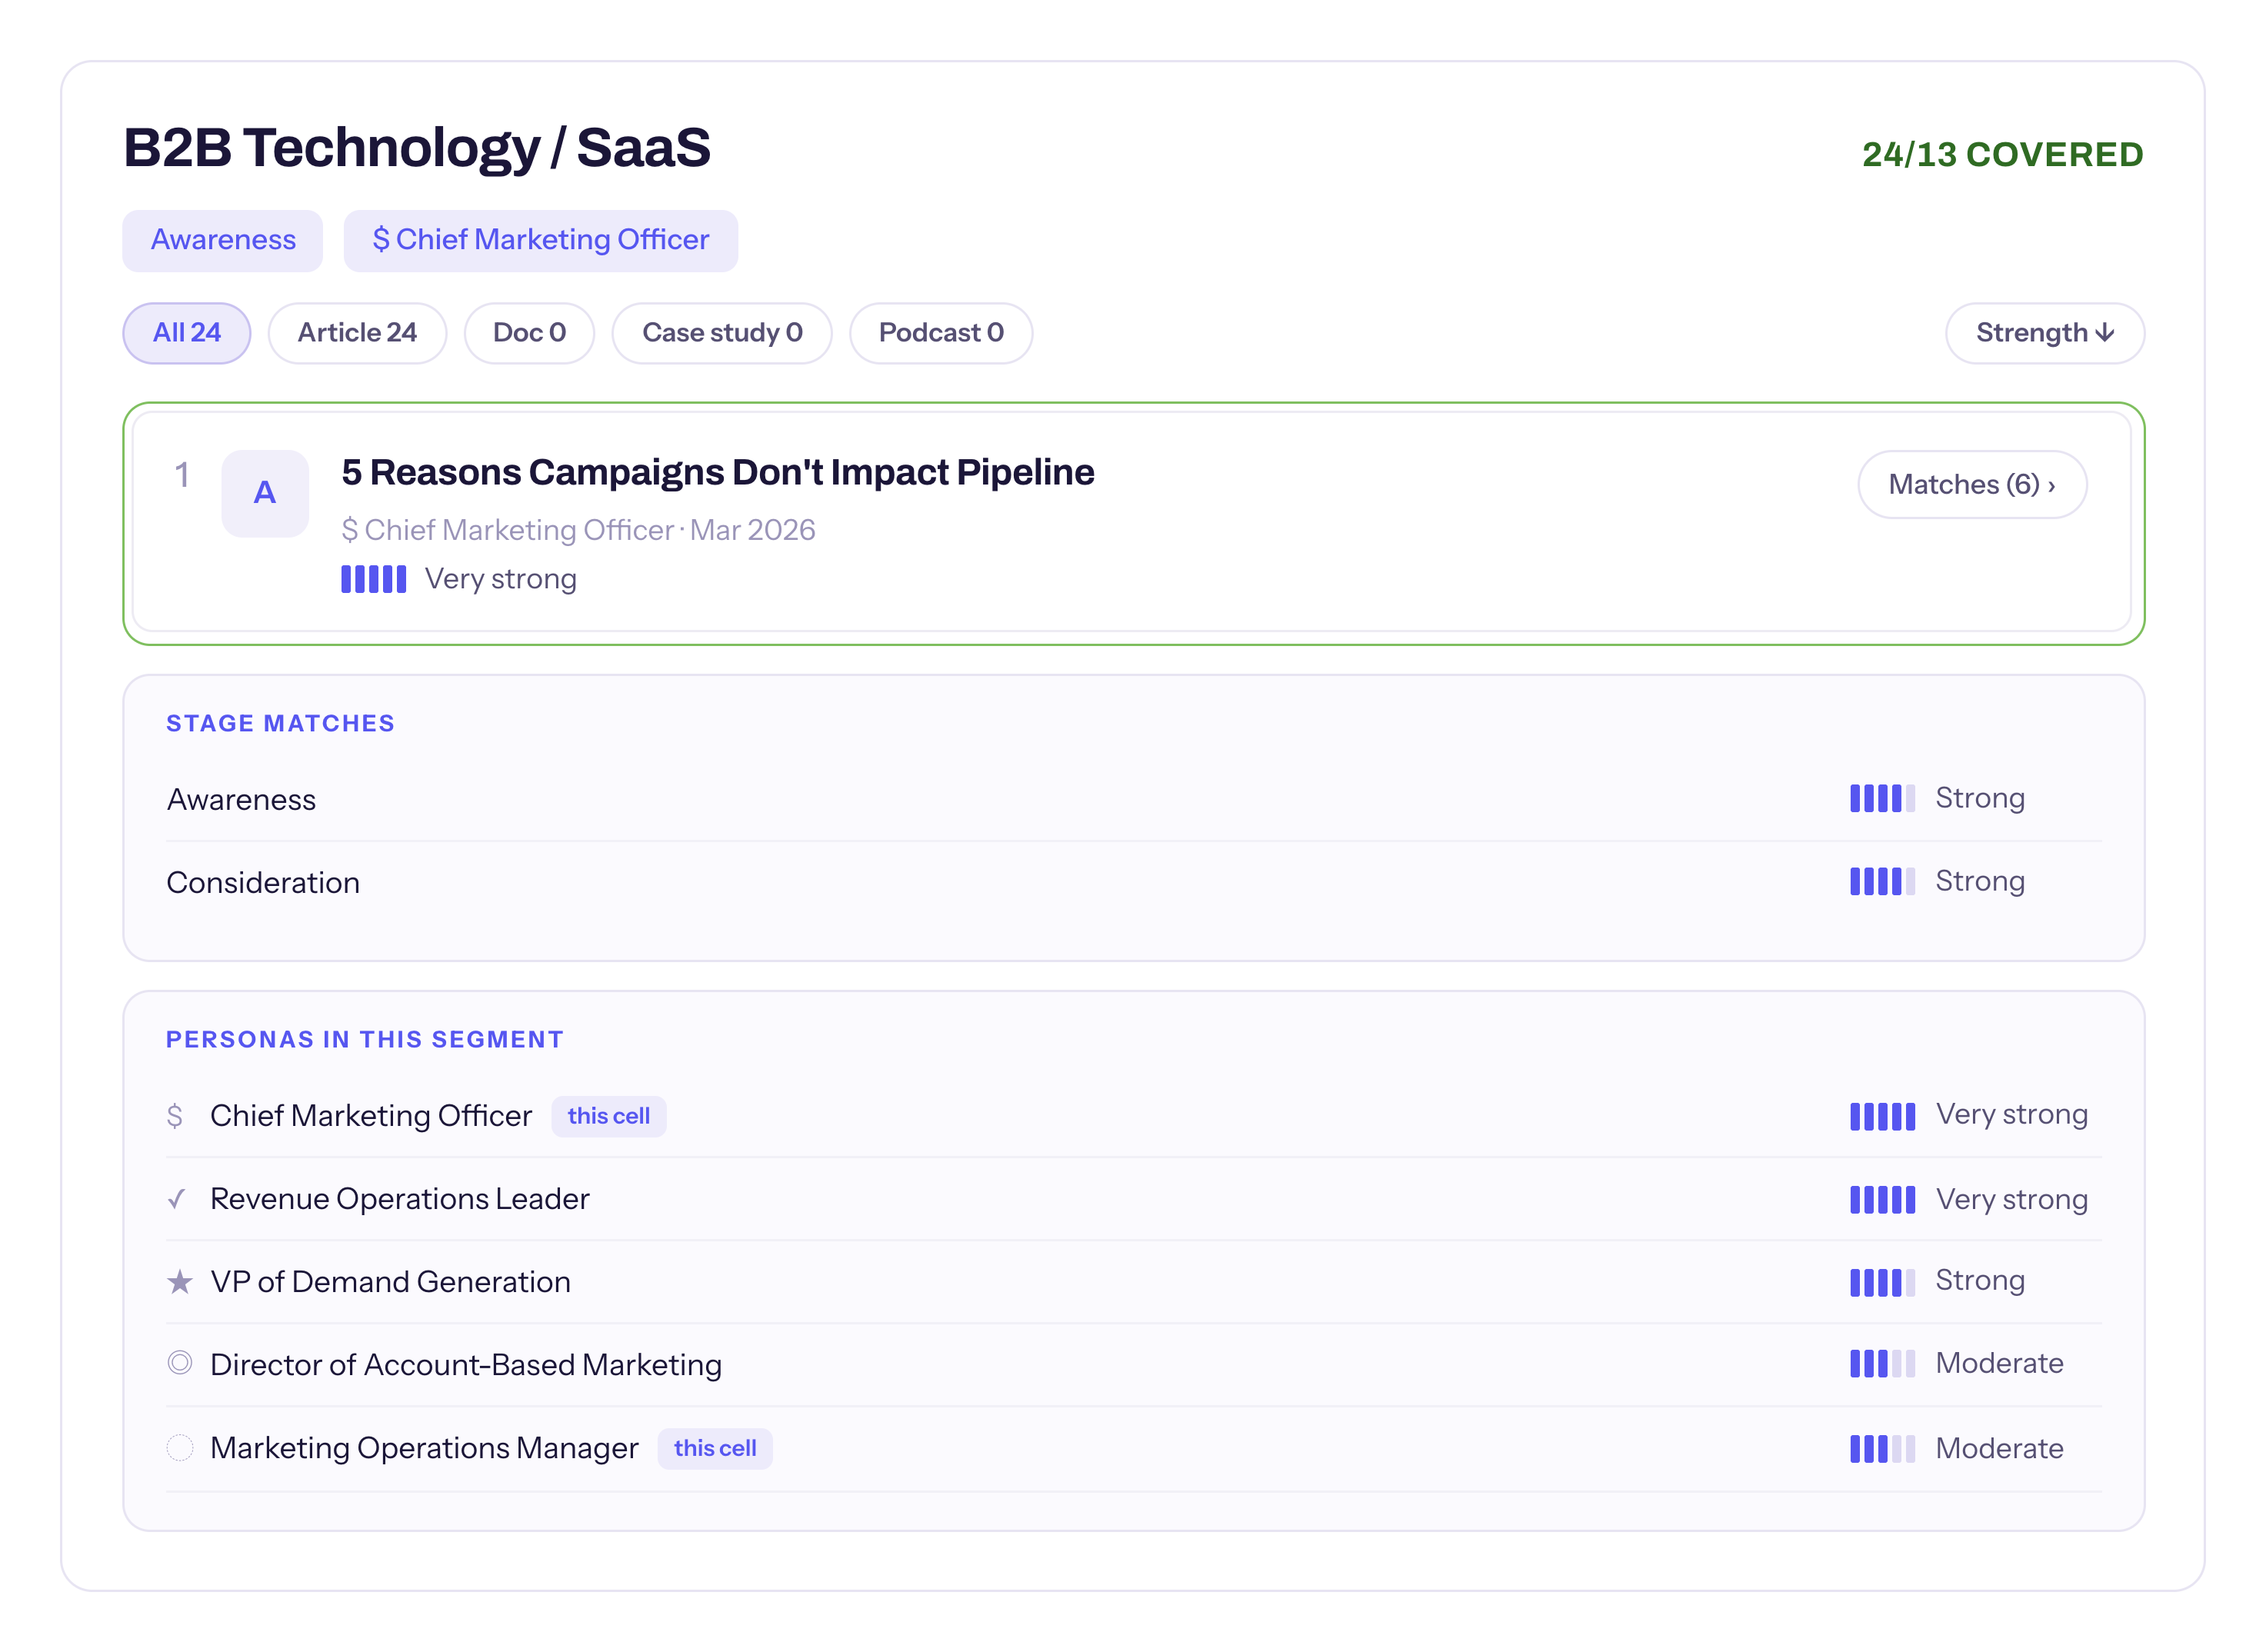

See the actual assets behind score with live links
Ranked by match strength to see the strongest content for AEO
Filter by publish date to find stale coverage that needs to be refreshed
cell-drilldown
Competitor Research

Run it on your competitors.

Point the same analysis at their site and compare their coverage against the segments and personas you're targeting

!
Open lane
Nobody covers the CFO.

Their ratifier row is as empty as yours, zero across every stage, with $1.0M of your plan behind that signature.

!
Persona strategy
They're all-in on your Champion.

They cover the VP of Demand Generation at every stage, 34 of 34. You cover 16.

Persona-level comparison

Where they are covered and exposed, so you can see where to take share of authority

Freshness

How recent their coverage is, so you know which of their strongest positions are aging out with AI answers

Positioning themes

The themes they anchor on per segment and persona, so you can see where your message collides with theirs and where you stand alone.

Delivery cadence by week

See how much they actually ship, and when, so you know the pace you are competing against.

Aim your campaigns at the gaps you can win.

Chris Hutchins - Audiense

There's never been a view like this. Every content decision is informed by either intuition or dated information. This finally makes content creation intelligent.

Chris HutchinsHead of Content, Audiense

See what your content covers.

Enter your email and we will run your content coverage heatmap.