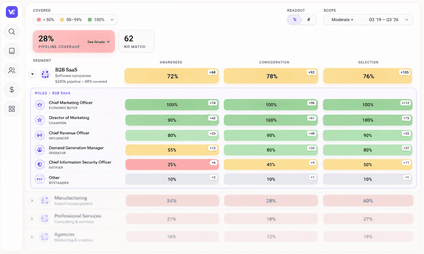
Why the buyers who join at consideration and selection still have nothing written for them.
TL;DR
- A full content library and a covered buying committee are different things. You can grow one without moving the other.
- When you plan by theme, most new content lands at awareness, where themes are easiest to express. Technical, financial, and risk-focused buyers at consideration and selection get less.
- Dashboards blend early-stage and late-stage engagement, so a missing selection-stage asset shows up as a sales request, not as a gap on a report.
- A typical B2B purchase now involves 13 internal stakeholders and 9 external influencers (Forrester, The State Of Business Buying, 2026).
- You can test for the gap yourself: assign each asset to the single buyer and stage it serves best, then compare that map with the requests sales keeps sending.
Most B2B marketing teams have more content than they did 2 years ago: more buyer guides, more product narratives, more campaign assets. The assignment was to grow the library, and your team delivered. Yet sales keeps asking for things the library doesn't quite answer, usually late in a deal and usually for someone who wasn't in the first meeting.
A library can be full and still say nothing to the person who signs.
Your analytics won't flag this. It ranks what you published, and it can't show you which buyers you never wrote for. So a CFO at selection or a security reviewer at consideration can go quarters without an asset written for their decision, while every report describes a healthy program.
Where coverage gaps concentrate
Most campaign planning starts with themes, launches, and asset types. That gives your team a workable structure, but it sorts content around internal priorities before anyone asks what each buyer needs. The next planning cycle then starts from whatever performed best last quarter, and a list of what already worked can only point back at what already exists.
Different buyers need different proof at different stages. A security leader at consideration needs implementation and integration detail. A CFO at selection needs a way to compare commercial trade-offs, and procurement needs risk language, often far earlier than marketing plans for it. Theme-led planning can serve all of them, but your team will write the most wherever the theme is easiest to express.
You'll see it in where the content sits, not in how much there is:
- Awareness-stage concentration. Thought leadership, trend reports, and introductory explainers pile up because they fit broad campaign themes.
- Consideration thinning. Technical fit, implementation, security, and integration questions get fewer dedicated assets.
- Selection thinning. Financial justification, procurement support, and executive risk materials arrive late, often as one-off sales requests.
Planning by theme buys you cohesive campaigns and faster production. What it costs is depth for the narrow decisions late-stage buyers face. That's why the pattern rarely looks like a production failure: your team shipped exactly the campaign it planned.
How much this matters depends on how you sell. A sales-led motion leans on selection content far more than a product-led one, so a thin selection stage costs a sales-led team more.
Why the pattern stays hidden
Top-of-funnel content draws more engagement because more people can engage with it, earlier and with less commitment. Your dashboard then gives the whole library credit for that activity. The program looks healthy even when late-stage buyers have very little to use.
Most dashboards blend the signals in 3 steps:
- Broad assets create activity. Introductory content draws engagement across the whole audience.
- Dashboards blend stage signals. Campaign, channel, and asset-type views combine early-stage and late-stage behavior.
- Sales finds the gap. Reps hear narrower questions that the library doesn't answer directly.
Your reporting isn't wrong; it answers a different question. It shows which assets drew engagement, which channels carried demand, and which campaigns touched pipeline. It can't show whether each buyer on the committee found something written for their decision.
That blind spot grows with the buying group. A typical B2B purchase now involves 13 internal stakeholders and 9 external influencers, and procurement is a decision-maker in 53% of buying cycles (Forrester, The State Of Business Buying, 2026). Each added stakeholder brings questions your awareness content was never written to answer.
Take a deal that reaches procurement review. Your dashboard shows strong engagement with product overviews and case studies. Procurement asks for a risk assessment nobody wrote, so the rep builds something on the spot, and the deal waits while they do.
By the time anyone notices, the gap has already turned into follow-up requests and repeated enablement asks. To the people involved, it reads as a sales problem.
What the gap looks like in practice
You'll usually hear the gap before you see it. A sales team has several strong case studies and nothing that helps a finance buyer compare commercial trade-offs. Product marketing has a sharp platform narrative and no short answer for a technical reviewer asking about implementation dependencies. The requests look unrelated because different people send them at different moments.
The same signs tend to repeat:
- Recurring late-stage requests. Sales keeps asking for validation, risk, or justification materials.
- Improvised assets. Reps adapt broad content for technical, financial, or executive buyers.
- Planning language drift. Your team describes the issue as bandwidth, timing, or sales follow-up.
One request says little. The same request from 3 reps in a quarter says a lot more.
How do you find buying committee content gaps?
Map every asset to the single buyer and funnel stage it serves best, then compare that map with the requests sales keeps sending. The empty cells, and the cells sales keeps asking about, are your gaps.
You can run the test on your own library in 2 steps:
- Review the last quarter of sales requests. List every asset sales asked for that a mature library should already have, and note the buyer and stage each one was meant for.
- Map your library, counting each asset once. Assign every asset to the single buyer and funnel stage it serves best, and count it only there. Count only strong matches: a passing mention of security in a product overview doesn't cover the security reviewer.
Counting once is the step most audits skip. If you tag a pricing page to the CFO, the champion, and the practitioner at the same time, every buyer looks covered and the map tells you nothing. Counted once, the empty cells are real.
What you're measuring is content coverage: whether your published content reaches the buyers, segments, and funnel stages your revenue plan depends on. Expect it to be less flattering than your asset count.
Once you have the map, work in this order. Refresh what's ageing in the cells you already hold. Fill the thin cells that carry the most revenue. Leave alone anything that's already well covered.
Taking this to your leadership team? Beyond the Content Audit: A CMO's Guide to Content Coverage shows how to map coverage against the revenue plan, turn gaps into a content calendar ranked by share of plan, and report coverage to the board. Get the free eBook.
FAQ
How do I know if our content covers the whole buying committee?
Sales usually works several roles per deal, but content tends to speak to 2 or 3 of them. Count each asset once against the buyer and stage it serves best, and the uncovered roles show up as empty cells.
Why don't content dashboards show late-stage gaps?
Dashboards rank what you published and blend early-stage and late-stage engagement. They can't show the buyers you never wrote for.
Does every sales request need a new asset?
No. Refresh aging assets in the cells you already cover first, then fill the thin cells that carry the most revenue.
Conclusion
A full library and slow late-stage progress can sit side by side for quarters. The way through is to judge each asset by the decision it supports.
Not every sales request needs a new asset. Start by seeing where coverage thins, which is usually exactly where buyers' questions narrow.
If you want to see where your own library lands, VelocityEngine's Content Coverage Heatmap maps your public content by segment, persona, and funnel stage, so you can see which cells are empty.
For more on why dashboards and coverage tell different stories, read The one thing your performance data doesn't show.