
<img height="1" width="1" style="display:none" src="https://www.facebook.com/tr?id=4246513698961258&amp;ev=PageView&amp;noscript=1">
The Content Coverage Heatmap

See which buyers in your revenue plan have nothing written for them.

The Content Coverage Heatmap maps every page you've published to the one buyer, segment, and funnel stage it serves best. Then it scores your coverage against your revenue plan and the competitors you name.

Get your free coverage scan →
41%
Coverage score
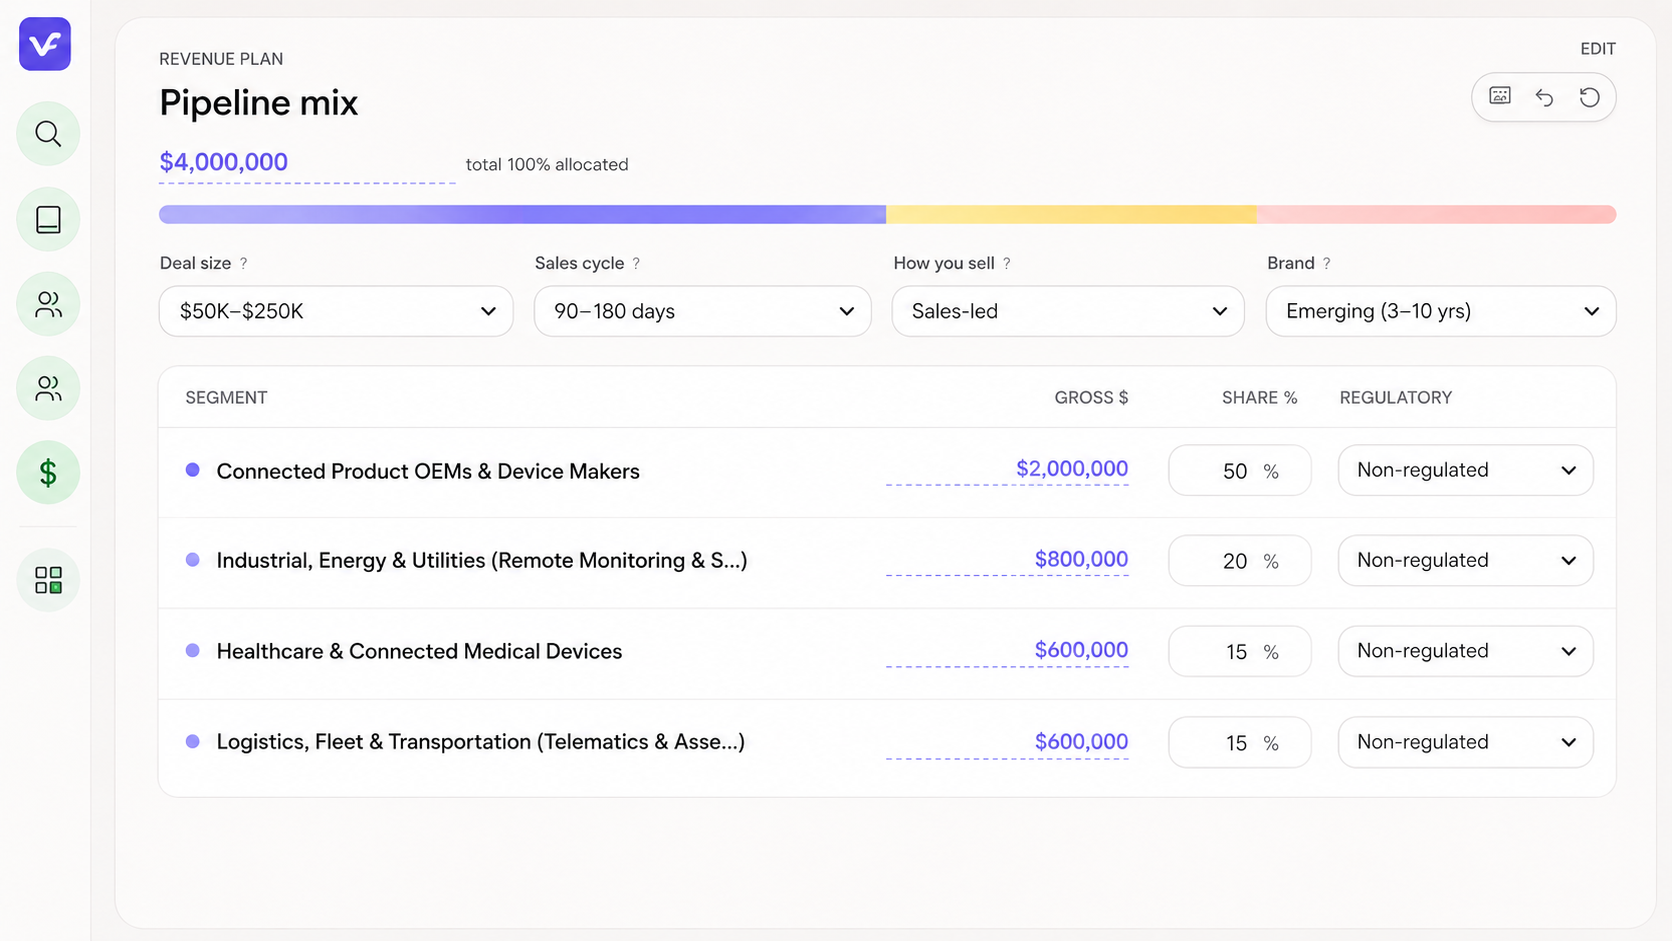
Your revenue plan
$13.2M
revenue exposed
AWARECONSIDERSELECTCOMMIT
SaaS Tech4321
FinTech31——
Health Tech2——1
Pro Svcs321—

You can count your content.
You can't tell if it covers your revenue plan.

Your revenue plan names the segments, buyers, and stages marketing is expected to reach. Your analytics can rank everything you've published, but it can't show you the buyer nobody wrote for.

So the next piece gets chosen from the performance of the last one, a loop that can only point back at what you already have.
Example coverage map by segment and funnel stage

How the map sets a target

10
segments
×
5
buyers
×
3
stages
=
150
cells
Each cell gets its own target, set from your deal size, sales cycle, sales motion, and brand maturity. A sales-led team needs more selection content, and a product-led team needs more at awareness. Past the target, a cell shows a surplus instead of asking for more, so the map tells you where to stop spending as well as where to start.

No published standard exists for how much content a buyer needs. This is our model. It's version-pinned, and you can argue with it.

Run your free coverage scan →
How it works

One map, from your content to your number.

Scans your content

Point it at your site. It reads every page you've published and places each one on the map, with no manual audit or spreadsheet.

Infers your buying committee

For each segment you sell into, it proposes the buyers, buying roles, and jobs to be done. You edit them before anything is scored, and every edit is saved as a version you can switch between.

Counts each asset once

Each asset goes in the one cell it serves best, and only there. We tried counting a page everywhere it could apply, and the score inflated until every buyer looked covered. Counting once keeps the gaps real.

Scores it against the plan

Only strong matches count toward a cell, and content ages: past 6 months it counts for less, and past a year less again. Each cell is compared to its target and weighted by the segments carrying your plan.

What you get

A coverage score, and the gaps behind it.

One number for how much of your revenue plan your content covers today, and the intelligence-driven map underneath it showing where coverage is thin, by segment, buyer, and stage.
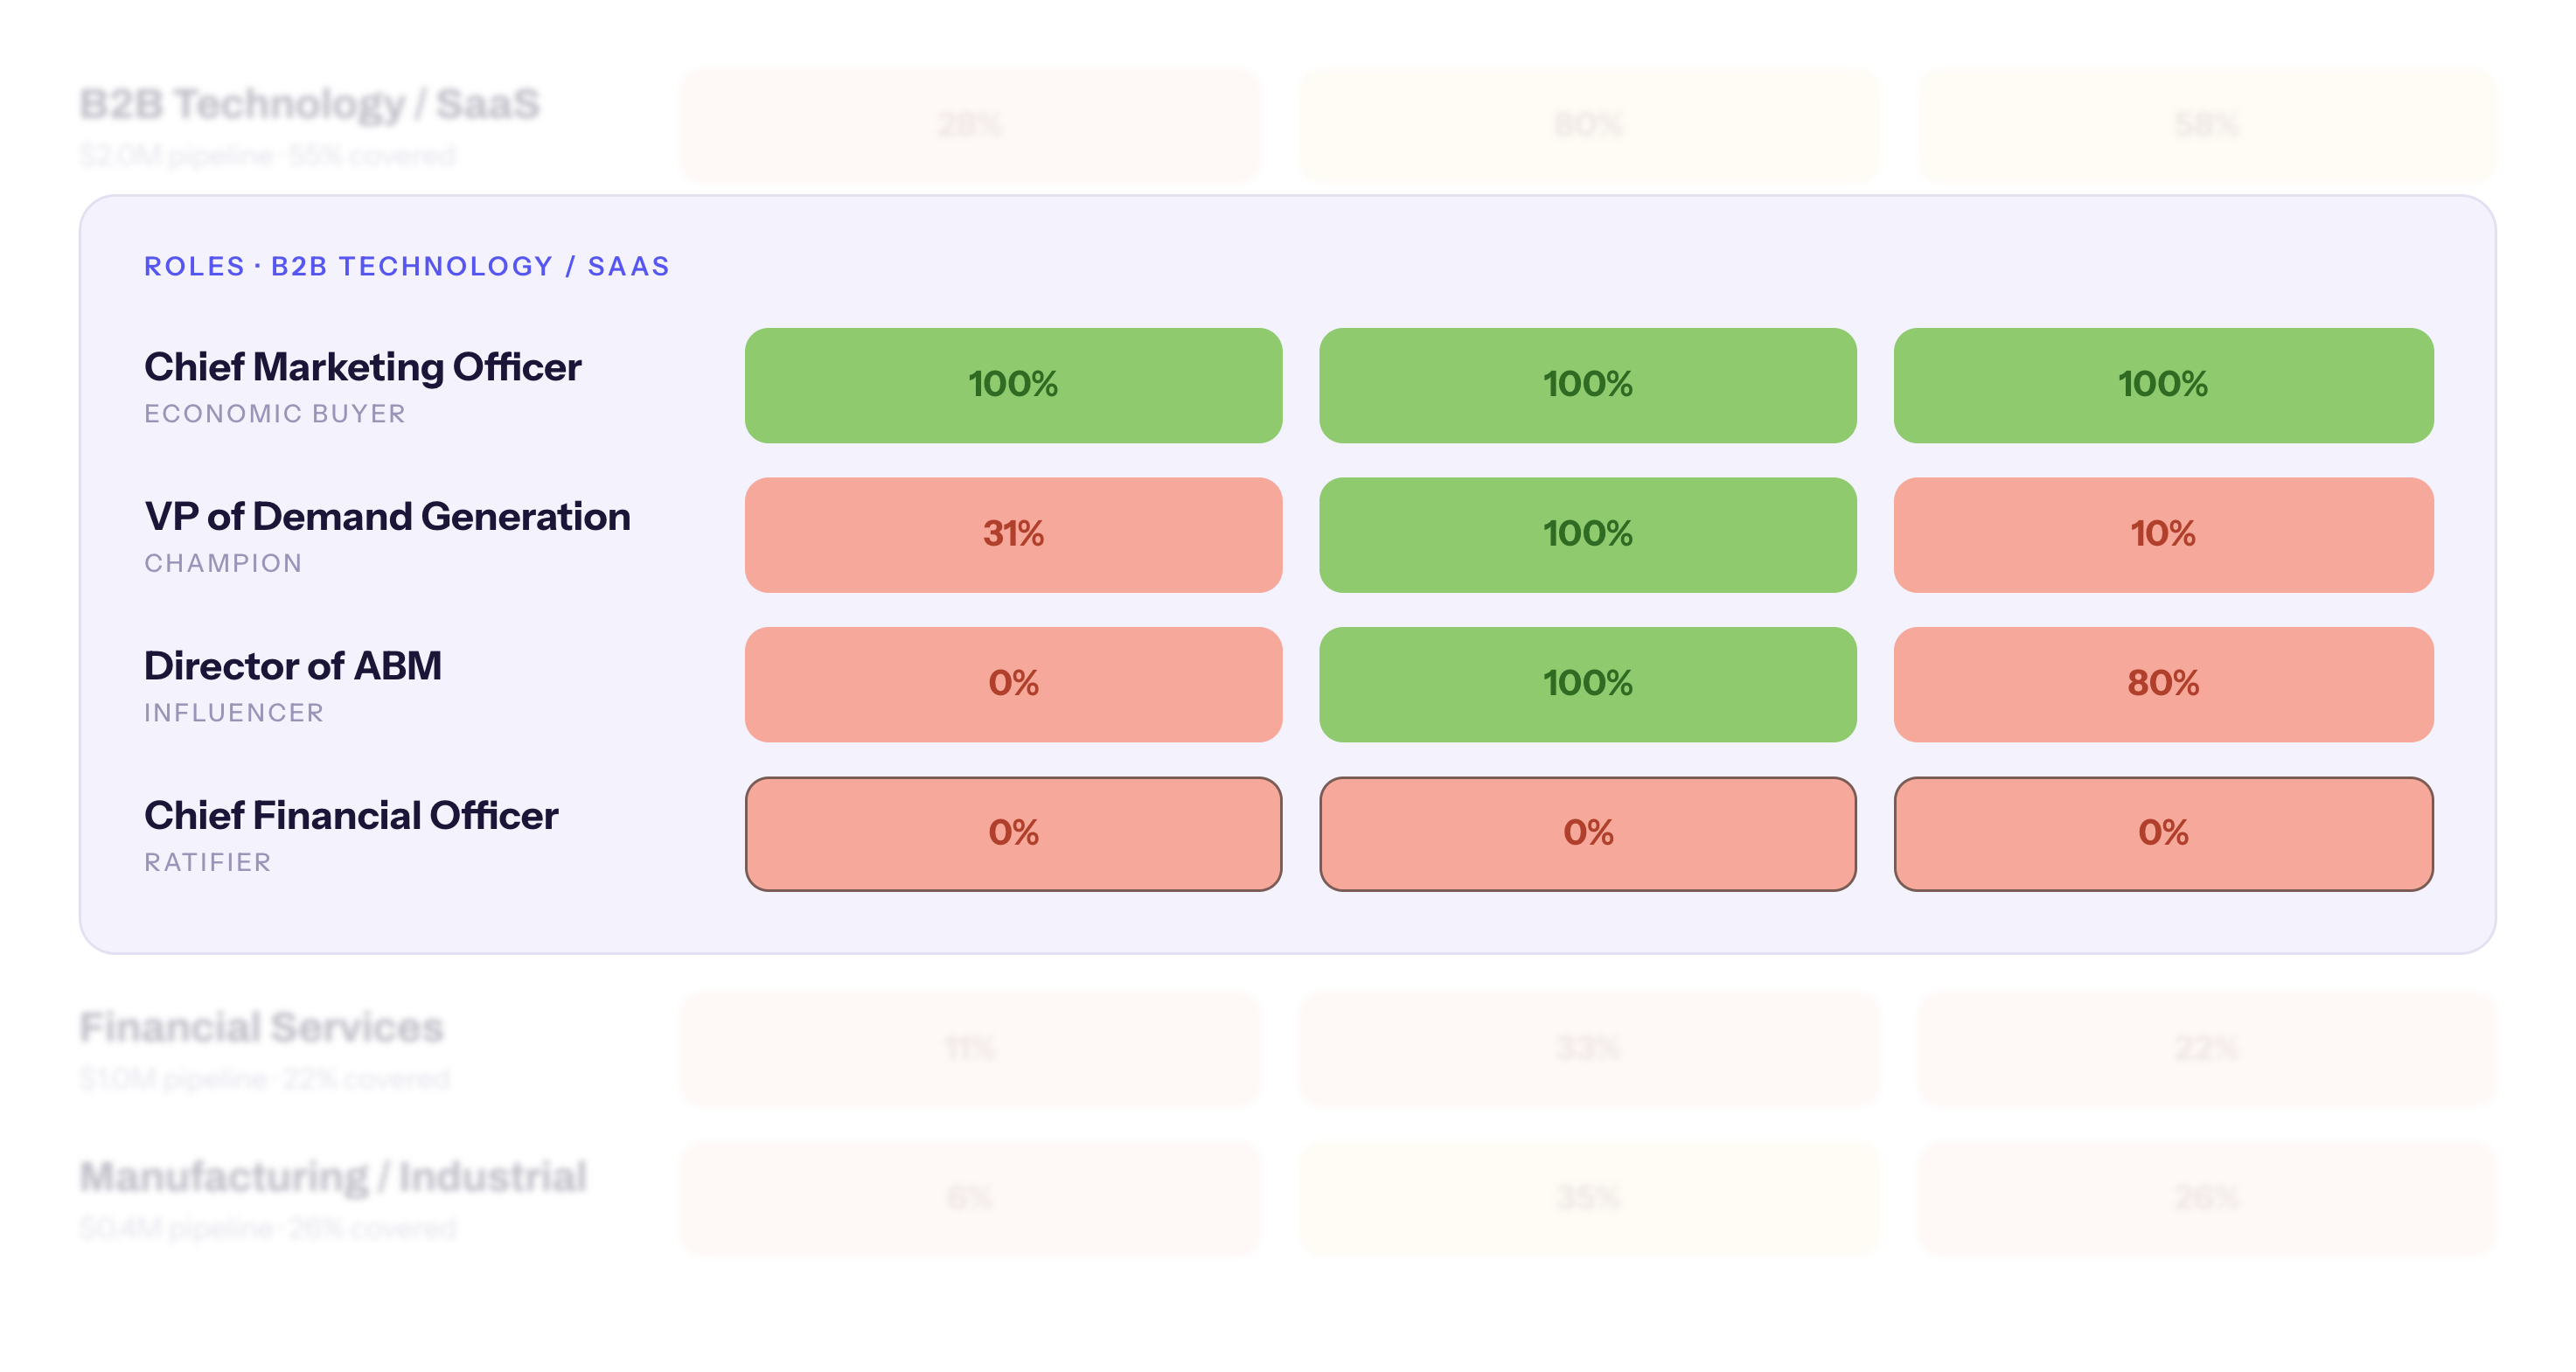
✓Your coverage score: One number for how much of your revenue plan your content covers.
✓Coverage weighted by your plan: The biggest gap by cell count and the biggest gap by revenue are rarely the same place. The map tells them apart.
✓The buyers nobody has written for: Down to the buyer and stage, in every segment.
✓How much of each committee you reach: Per segment, how many of the buyers you defined have anything strong written for them.
✓One shared view: Sales and marketing see the same coverage, scored against the plan they're both selling.
Buying committee coverage by role, per segment
!
Action signal

The CFO signs off on the purchase and has nothing written for them at any stage. That's the clearest place to build next.

See your gaps, and what to solve next.

See where your coverage is thin →
No black box

Every cell shows its work.

Open any cell to see the assets behind it, ranked by how well they match that buyer and how recently they were published.
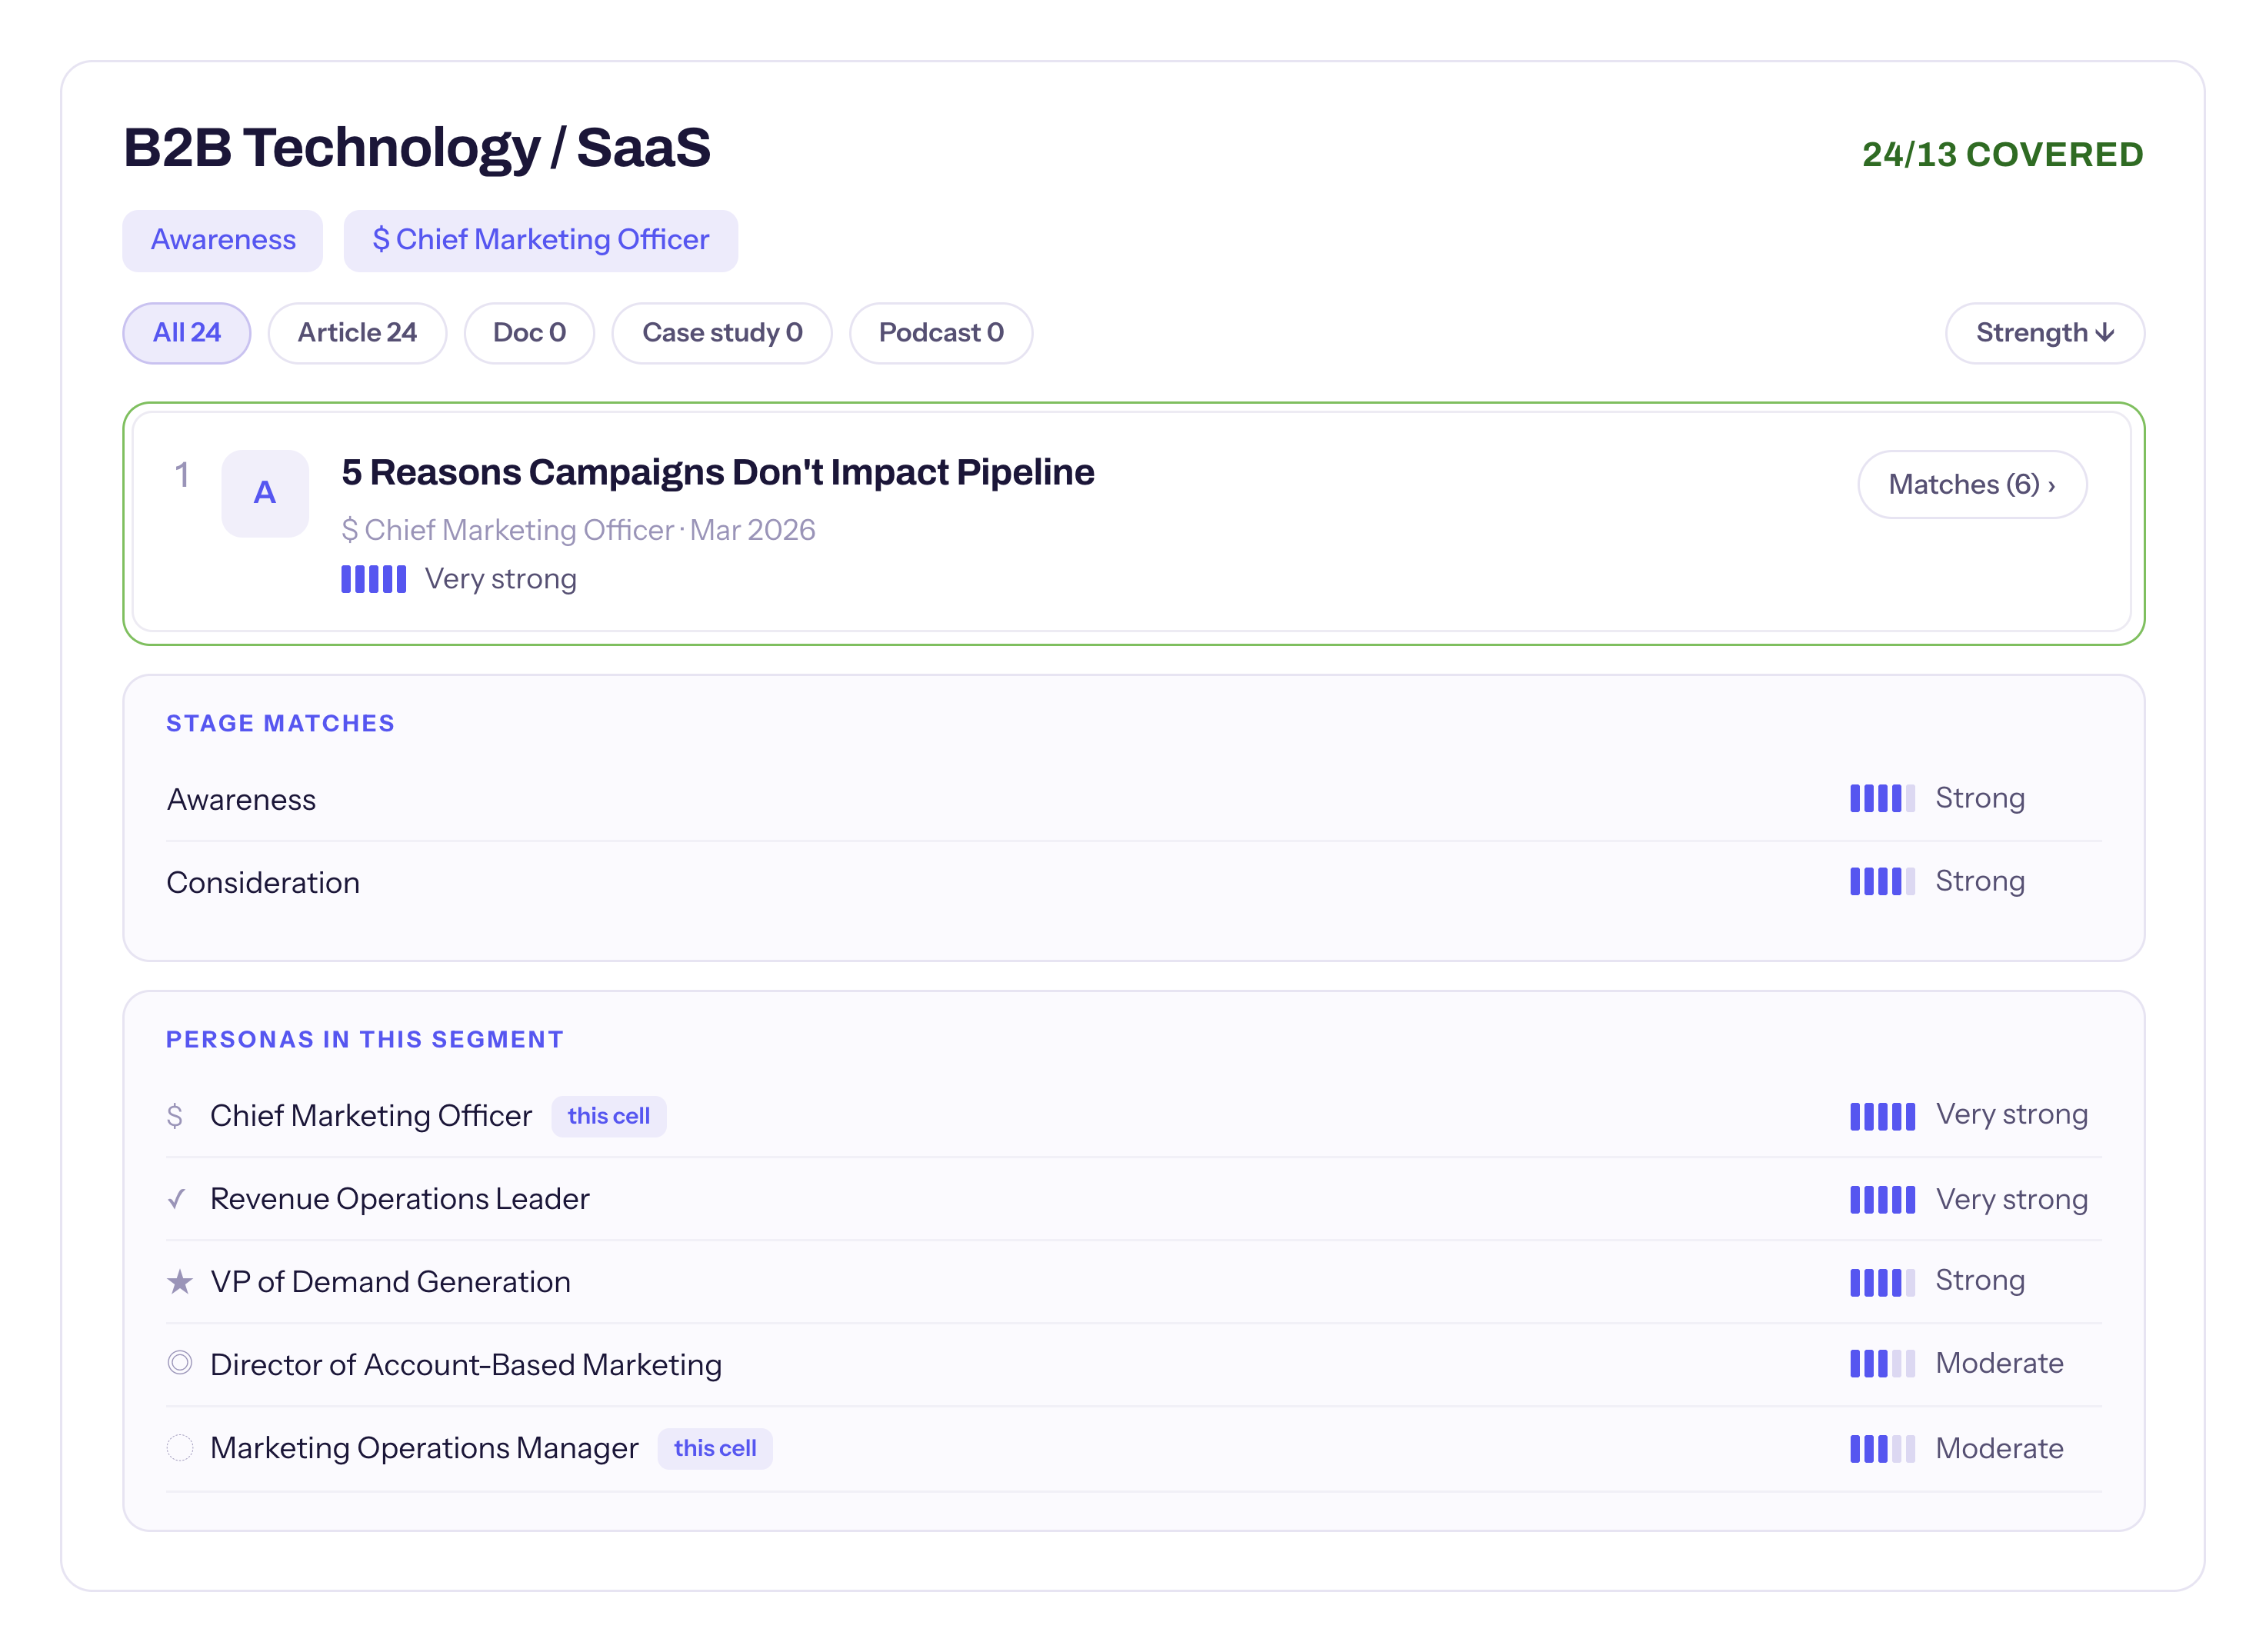

✓The assets behind every number. Live links to each asset, with the buyer and stage it was matched to.
✓Ranked by match strength. Only strong matches count toward a cell, so a passing mention doesn't earn it.
✓Filtered by publish date. Find cells held up by content old enough to be losing standing.
✓Disagree with a call? Edit your taxonomy or tell us. Every edit is versioned.
Assets behind one coverage cell, ranked by match strength
Competitor Research

Run it on your competitors.

Point the same analysis at a competitor's site. Their content is mapped on your segments and buyers, not theirs, so the comparison is cell by cell. You see where you lead, where they're writing for someone you aren't, and where nobody has written anything yet. Pick the vendors you actually meet in deals. A category giant with 10 times your library will swamp the read.

  • Buyer comparison — who each of you has written for, cell by cell
  • Freshness — which positions, yours and theirs, are aging out
  • What changed — what they've published since your last run

Aim your campaigns at the gaps you can win.

YouCoverage 41%
AwareConsiderDecideCommit
CMO
VP Demand Gen
Director of ABM
CFO
Competitor ACoverage 48%
AwareConsiderDecideCommit
CMO
VP Demand Gen
Director of ABM
CFO
!
Open lane
Nobody has written for the CFO.

Both ratifier rows are empty, in segments carrying $1.0M of your plan.

!
Persona strategy
They own your champion.

They have 34 strong assets for the VP of Demand Generation. You have 16.

Then build what's missing.

The map is the diagnosis. The Campaign Operating System builds the content to close the gaps, from one governed foundation of your messaging, positioning, personas, and proof. Use the map on its own, or both together.

Chris Hutchins - Audiense
“

There's never been a view like this. Every content decision is informed by either intuition or dated information. This finally makes content creation intelligent.

Chris HutchinsHead of Content, Audiense

Common questions

1We have hundreds of pieces of content. Where did they all go?

They're all there. Each piece is counted in the one cell it fits best, so a library can be large and still concentrated on one or two buyers. Sharpening your buyer and segment definitions usually spreads the content out, and that's the first thing to do with the map.

2Where does the target number come from?

Your revenue plan. Deal size, sales cycle, sales motion, and brand maturity each move it. No published standard exists for this, so we've taken a position, version-pinned it, and made it open to argument.

3Isn't this Semrush?

Semrush tells you which pages rank for which queries, and most of our customers keep it. It can't tell you which buyer a page serves, at which stage, in which segment. Its unit is the query. Ours is the person.

4Couldn't we build this ourselves?

Often, yes. What breaks is consistency: classification drifts as the context window loses the taxonomy, and the map only works if it holds across thousands of assets and a whole team.

5How do I know the matching is any good?

Load your messaging frameworks, positioning decks, persona research, and competitive battlecards into one place. VelocityEngine analyzes structure, identifies gaps, and normalizes format so everything works together from day one.

6What do I do once I have the map?

Three things, in order. Refresh what's aging out in cells you already hold. Fill the thin cells that carry the most revenue. Leave alone anything already at its ceiling.

See what your content covers.

From your URL, in about an hour. It reads public web content only, with no access to internal systems.