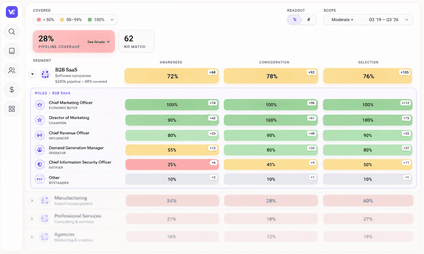
What a content coverage heat map shows a CMO that a content audit, asset inventory or a campaign dashboard cannot.
TL;DR
- Analytics ranks what you published. It cannot show you the buyer nobody wrote for, because a page that was never written sends no signal.
- A coverage map assigns each asset to the one segment, buyer, and funnel stage it serves best, and counts it only there, so an empty cell is a real gap.
- Coverage is weighted by the segments your revenue plan prioritizes, so you can tell the biggest gap by count from the biggest gap by revenue.
- Running the same map on the competitors you name shows where you lead and where they are addressing buyers you are not.
- The map says where to stop spending as well as where to start. It measures coverage, not performance, and should be presented that way.
In the planning review, sales says 2 enterprise segments feel thin. Marketing points to a library of 200 assets. Product marketing points to the positioning it refreshed last quarter.
All 3 teams are right. Each is reporting accurately on a different question, and none of those reports says who the content actually reaches.
Your campaign dashboard can't settle it. A page that was never published gets no visits and no conversions, so your analytics platform has nothing to report. The dashboard looks the same whether a segment is well served or was never addressed.
A content coverage heat map answers the question the other reports can't: who your published content speaks to, and who it leaves out.
Content coverage is the measure of whether a company's published content reaches the buyers, segments, and funnel stages its revenue plan depends on, and how that position compares to the competitors it names.
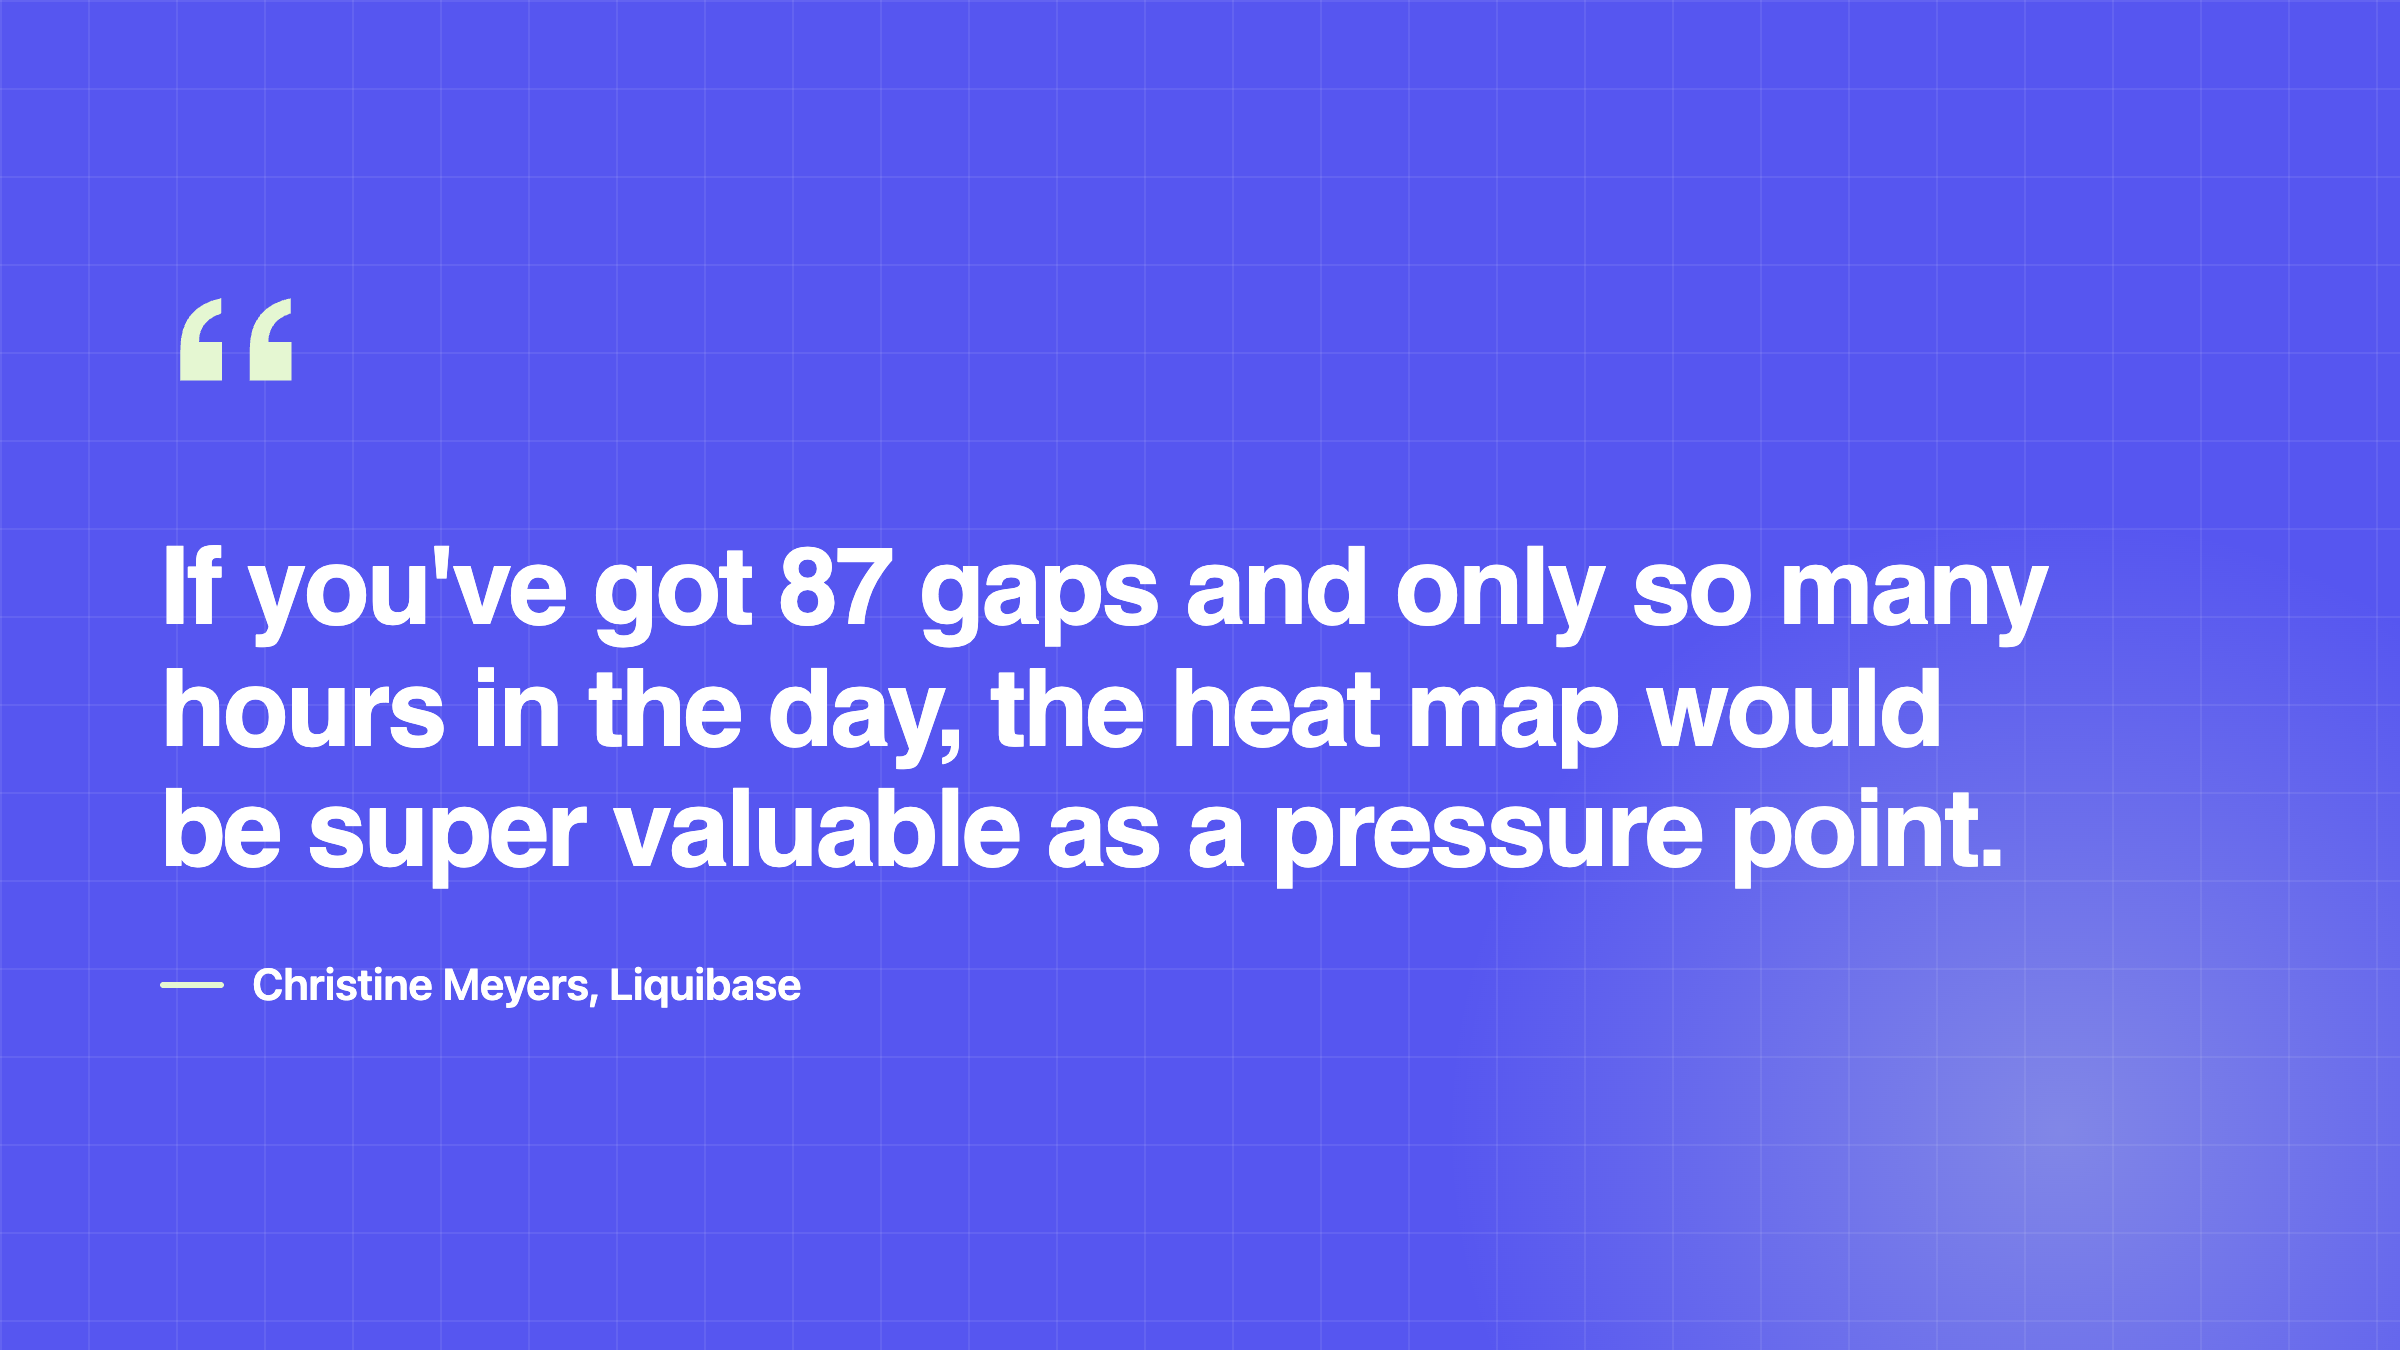
Content coverage versus a content audit
A content audit tells you what you've published. A coverage audit tells you who it serves. An inventory catalogs assets by type, topic, date, and owner, and a campaign dashboard scores what moved. Neither asks whether every segment, buyer, and stage in the plan has something that serves it well.
Take a horizontal sales technology company moving upmarket. Its library is strong for mid-market sales leaders at awareness. Its new enterprise deals bring in procurement, a security reviewer, and a financial signer, and the library has almost nothing for any of them at consideration or selection. The dashboard keeps favoring the mid-market content because that's the content with traffic and history. The enterprise buyers never appear in it at all.
B2B buying groups commonly include 5 to 16 people across several functions. A library aimed at 1 role doesn't cover that deal, even when the inventory looks complete.
We learned how to count this the hard way. When we first built the Content Coverage Heatmap, we counted a page everywhere it could plausibly apply. A pricing page counted for the CFO, the champion, and the practitioner at once. The score climbed until every buyer looked covered, and the map stopped telling anyone anything.
Now each asset goes to the one segment, buyer, and stage it serves best, and counts only there. Scores dropped for everyone, including us. It's a less flattering number, and it's how a 200-asset library can leave most of an enterprise buying committee untouched.
How a content coverage map is built
Rows are the segments you've decided to sell to, such as enterprise fintech, provider-facing healthtech, or insurance carriers. Columns are the buyers in those deals and the stages they move through: awareness and education, consideration, and selection.
Each cell gets a target calculated from your revenue plan. Deal size, sales cycle, motion, and brand maturity each move it, and a sales-led company needs more selection content than a product-led one. No published standard exists for how much content a buyer needs, so the target is a position we've taken and can defend, not an industry benchmark.
Only strong matches count toward the target. A passing mention of security on a product page doesn't earn the security reviewer's cell. Content older than 6 months is discounted, and more so after a year, so a cell can lose standing without anyone touching it.
Once the cells are scored, you can read the map 3 ways:
- Committee completeness. In enterprise fintech, you might be reaching 2 of the 5 buyers you defined for those deals.
- Concentration. Most of what you've written for a segment can land on the practitioner, with nothing for the person who signs.
- Stage shape. A sales-led team can discover that most of its library sits at awareness.
Then run the same map on a competitor you meet in deals, on your taxonomy. You'll see where you lead, where you're 1 asset from leading, and where they're addressing a buyer you've never written for. Keyword and answer-engine tools report on queries and prompts. They don't know your segments or buyers, so they can't make this comparison.
Expect the map to show a library more concentrated than you believed. That's uncomfortable to see, and it's the most useful thing the map produces.
Named cells instead of competing dashboards
When sales, marketing, and product marketing work from the same map, the argument moves from reports to specific cells. "Enterprise healthtech CFO at consideration" and "fintech security reviewer at selection" are pieces of work someone can own and finish.
Every cell opens to the assets behind the number, with the buyer and stage each was matched to. Sales can dispute a specific call. Product marketing can check whether the proof it expects actually exists.
With the cells named, each team has a defined job:
- Sales - Confirms which thin cells show up in live deals.
- Product marketing - Defines the proof, positioning, and objection handling each cell needs.
- Demand generation - Sequences production against the cells that carry the most of the plan, with owners and ship dates.
You can then bring the executive team a list of uncovered buyers in the segments carrying the plan, with an owner for each gap.
Be clear about what that list is. The heat map doesn't read performance data. It records what exists and who it serves, which makes it an input to the forecast.
Prioritizing content gaps with flat headcount
With flat headcount, your team can't fill every thin cell, and treating every gap as urgent just recreates the volume problem. Start with the gaps in the segments carrying the most revenue.
Because coverage is weighted by those segments, the biggest gap by count and the biggest gap by revenue are rarely in the same place. A missing selection asset for the enterprise fintech security reviewer can outrank 6 awareness gaps in a mid-market segment that already converts.
The map also sets ceilings. Once a cell passes its target, it shows a surplus. Most teams don't expect a measure that tells them where to stop spending.
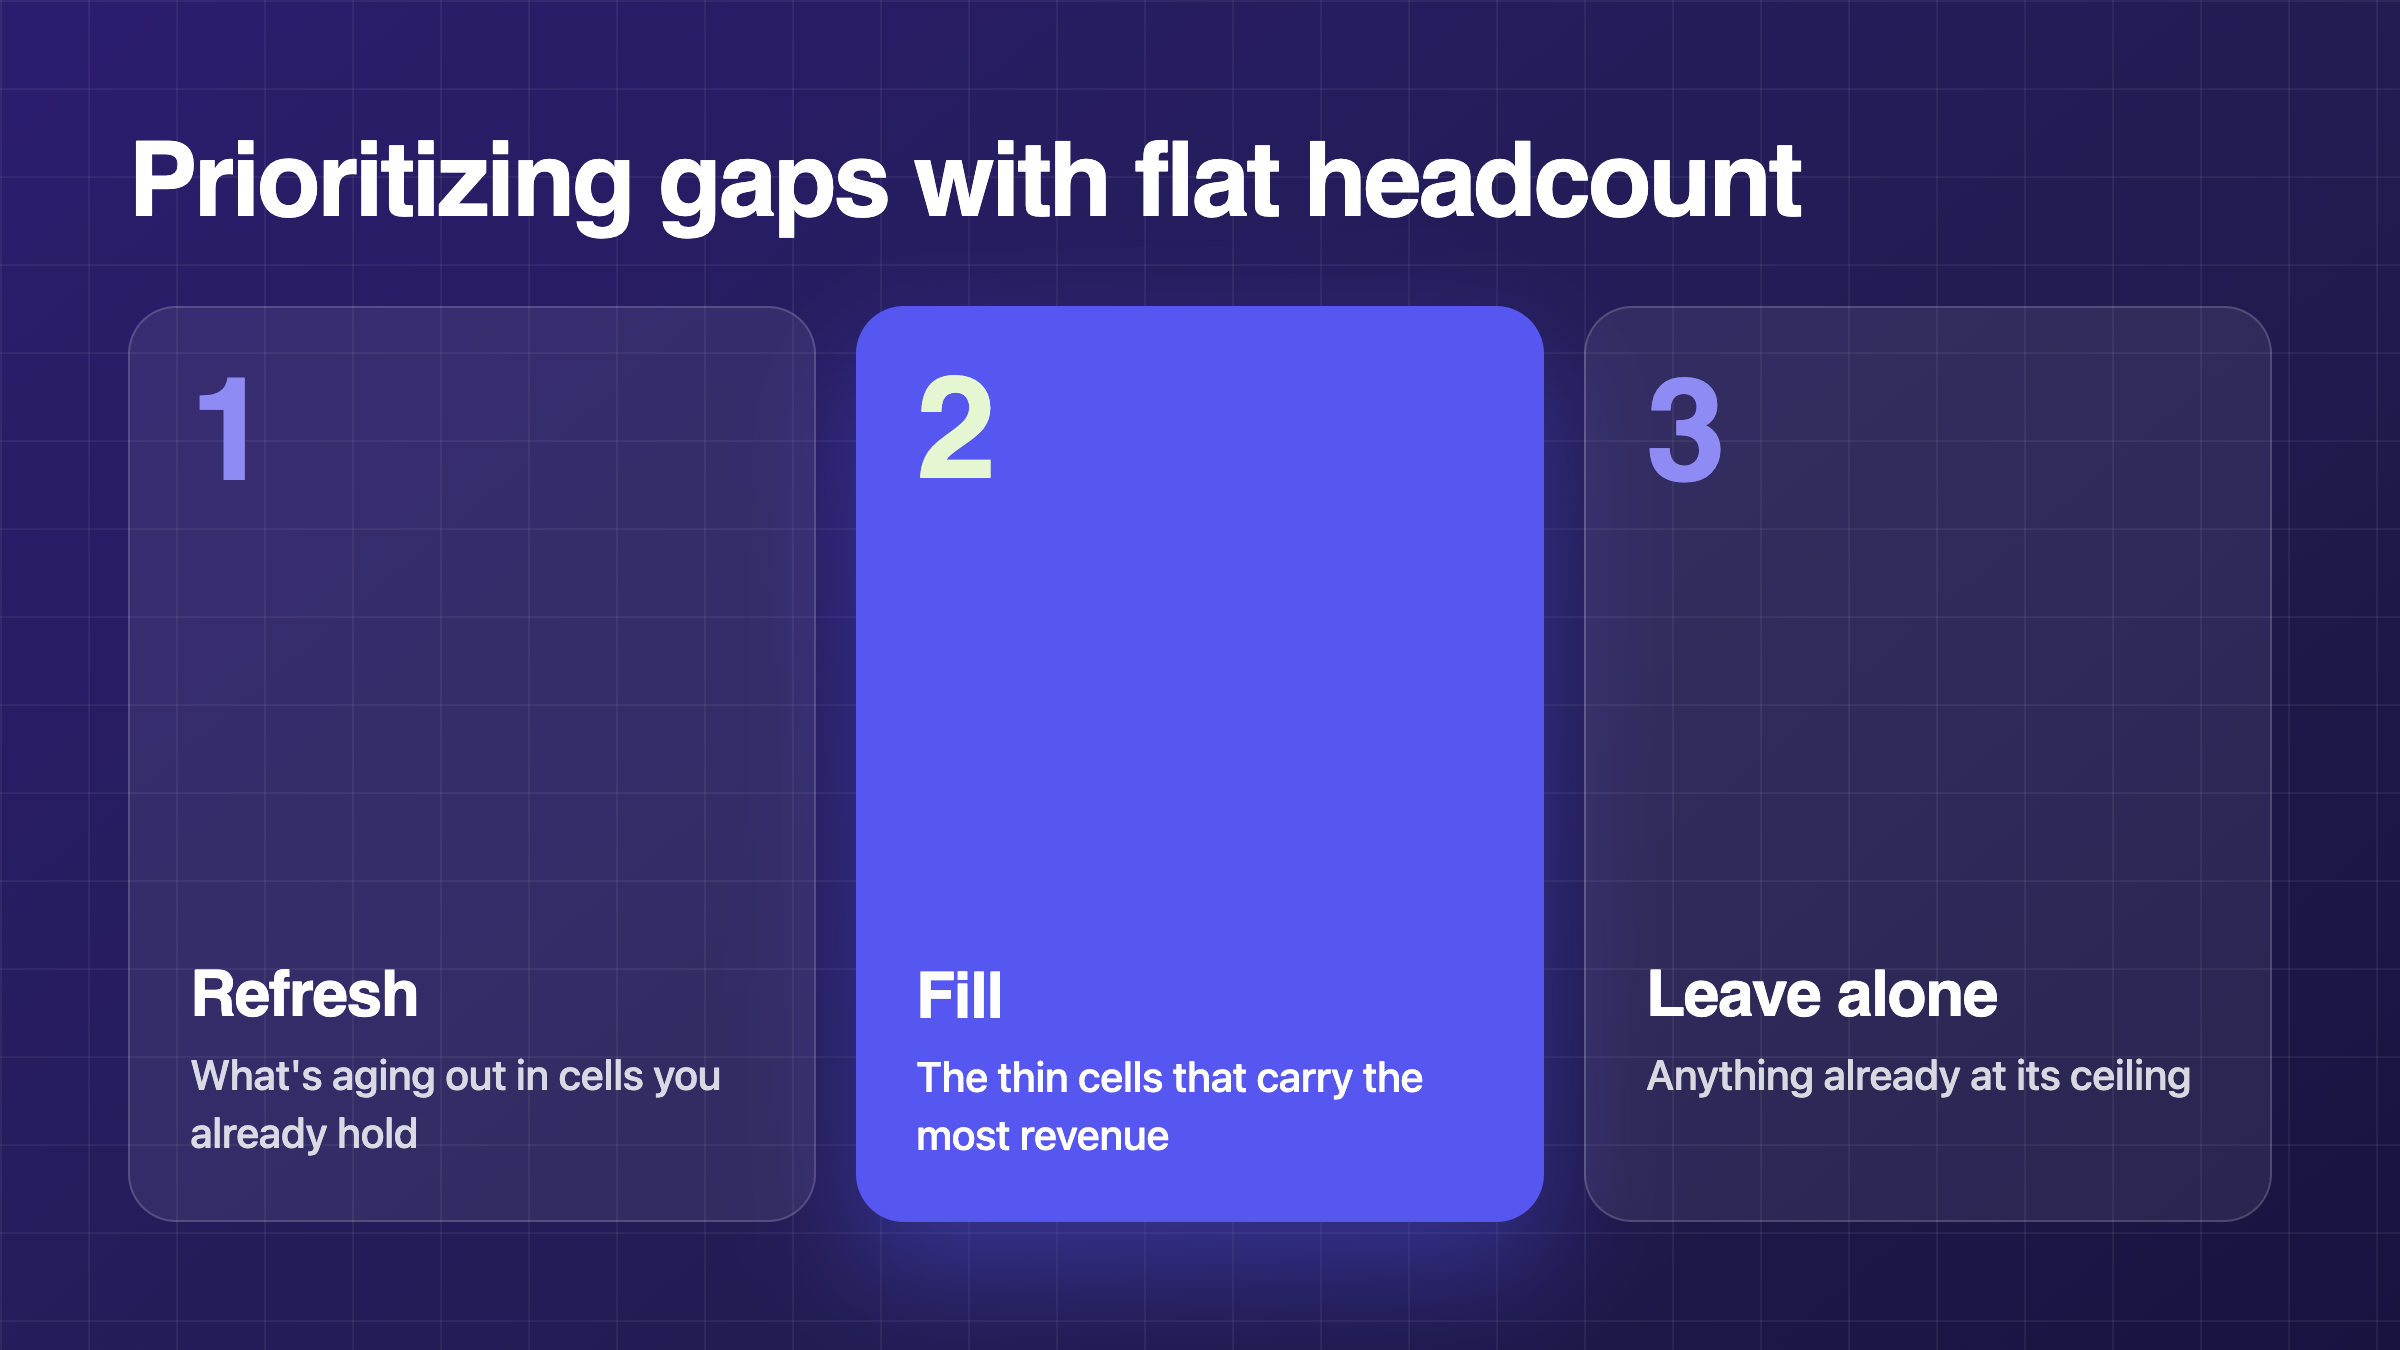
Work the result in 3 steps:
- Refresh what is aging out in cells you already hold.
- Fill the thin cells that carry the most revenue.
- Leave alone anything already at its ceiling.
Once you choose a gap, the Campaign Operating System builds the content to close it. It works from one governed foundation of your messaging, positioning, personas, and proof, so new assets stay consistent with everything else. Setting that foundation up properly takes real work before the first campaign ships.
Frequently asked questions
What is the difference between a content audit and a content gap analysis?
An audit catalogs what you've published. A gap analysis asks what's missing. Most gap analyses compare your keywords with a competitor's. A coverage analysis compares your library with the buyers, segments, and funnel stages in your revenue plan.
How do you measure content coverage?
Map every published asset to the one segment, buyer, and funnel stage it serves best, and count only strong matches. Compare each cell to a target derived from your revenue plan, and discount content as it ages. Then run the same map on the competitors you meet in deals.
Can analytics show content gaps?
Analytics can't show gaps for buyers you never wrote for. It reports on the performance of published pages, and a page that does not exist produces no data.
Does content coverage affect AI search visibility?
Answer engines draw on what's been published. If nothing on your site addresses a given buyer, an engine has nothing of yours to use when that buyer asks. Coverage doesn't guarantee a citation. It's the part of the problem you control.
Where to start
Before your next planning cycle, take the segment carrying the most of your plan and list every buyer in those deals. For each one, find a single strong asset at each stage. The places you come up empty are your first list.
If you'd rather not count by hand, the scan does it from your URL.
See who your content reaches. Run a free coverage scan on your site.