Short answer: Your campaign analytics show what performed. Competitive marketing intelligence shows whether your positioning survived it, persona by persona: map every shipped asset to the persona, segment, funnel stage and message pillar it serves, and check that it carries the approved positioning.
TL;DR
- Campaign analytics show what moved through the funnel. They can’t show whether your positioning reached the personas it was built for.
- Treat every shipped asset as a positioning inheritance event: which persona, segment, funnel stage, message pillar, and competitive context it carried, and whether it carried them intact.
- Map that as a coverage heatmap to see where your positioning is missing, diluted, or exposed to competitors, then fix it before the launch cycle closes.
Campaign analytics answer the question you already know how to ask. You can pull pipeline influence, conversion rates, and stage progression before the weekly standup ends.
Here is the question most product marketing teams can’t answer: which personas actually received your intended narrative last quarter?
Not which personas the campaign targeted. Which ones the shipped assets reached with your positioning intact. The gap between those two answers isn’t a reporting lag. It compounds with every launch cycle that closes without anyone closing it.
Standard dashboards track channels and assets. Positioning drift happens out of sight, inside personas, segments, and message pillars. When drift goes unmeasured through a launch cycle, your sales team meets buyers who never heard the agreed narrative.
Why doesn’t campaign performance prove your positioning worked?
Campaign performance proves something moved through the funnel. It doesn’t prove your positioning moved with it.
The metrics you report aren’t neutral. They carry a bias toward what is measurable, and that bias shapes what gets managed. Qualified traffic, demo requests, pipeline influence, and conversion rates confirm a response. An asset can drive strong stage progression while carrying a compressed value proposition, the wrong persona frame, or a competitive narrative your last positioning review rejected. The dashboard registers the response. It can’t register the drift. That’s the limit of what your content performance data doesn’t tell you.
Consider a fintech platform launching a risk-reduction campaign. Finance leaders engage. Demo requests climb. The campaign reads as a success. But the mid-market operations persona, the one the positioning strategy named as the primary expansion segment, appears in a single late-funnel sales deck. The compliance differentiation the product team spent a quarter building shows up nowhere in paid, nurture, or launch assets. The campaign performed. The positioning didn’t survive it.
This is the measurement error most PMM teams inherit without choosing it:
- Campaign analytics aggregate at the channel and asset level.
- Positioning drift accumulates at the persona, segment, message-pillar, and competitive-context level.
- The two layers rarely share a reporting surface.
When performance data stands in for positioning evidence, you optimize toward visible activity. By the time analyst questions or competitive displacement surface the problem, the launch cycle that produced it has closed.
The shift is from measuring asset delivery to measuring positioning inheritance. That lets you catch and correct positioning drift before the launch cycle ends.
What is positioning inheritance, and how do you trace it?
Positioning inheritance is whether a shipped asset carries the approved positioning for the persona, segment, funnel stage, and competitive context it was built for. You trace it by checking each asset against the positioning it was supposed to inherit, not just logging that it shipped.
The usual frame treats each asset as a production output: written, reviewed, published, attributed. What it leaves out is the more important question: which positioning did this asset carry, and did it carry it intact?
Inheritance tracking maps approved messaging to the full surface area of your go-to-market motion:
- Webpages, landing page variants, and product pages
- Nurture sequences and triggered email programs
- Launch blogs, thought leadership, and category campaign assets
- Paid ad copy across search, social, and display
- Sales decks, one-pagers, and battle cards
- Webinar scripts, demo narratives, and partner co-marketing copy
- AI-generated derivatives produced from any of the above
That last category is the fastest-growing source of untracked variation, and it’s where positioning breaks down at the point of production. Generative AI produces assets far faster than manual PMM review can keep up. Regional teams localize claims. Demand teams compress nuance for paid channels, where character limits become positioning decisions. Sales teams remix decks without knowing which version is current. Each adaptation is a branch point where the message leadership approved separates from the one that shipped.
When you can see which source positioning each asset used, what changed in adaptation, and whether the change kept or diluted the intent, you can tell consistent coverage from coincidental coverage, and both from no coverage at all.
The difference matters. A segment that appears across 12 campaign assets, all carrying the same compressed, off-strategy value proposition, isn’t covered. It’s misrepresented at scale.
How does a coverage heatmap show where your positioning is missing?
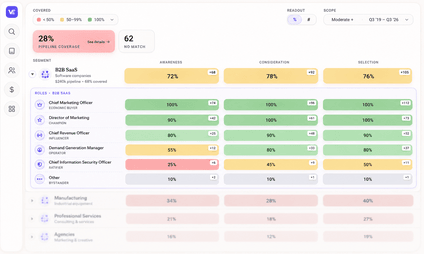
A coverage heatmap lays your content over the personas, segments, and funnel stages your plan depends on, and marks each cell covered or exposed. It doesn’t report on what shipped. It makes the absences visible, and absence is where go-to-market risk lives.
VelocityEngine’s Content Coverage Heatmap scores your content by segment, persona, and funnel stage. Drill into any cell and check the assets there against your message pillars. That shows whether a covered cell carries your positioning or just the topic.
Consider a healthtech SaaS team running what looks like a comprehensive campaign. The map shows heavy top-of-funnel coverage for clinical leaders. For financial buyers, the proof is thin. No asset connects workflow efficiency to reimbursement risk, the specific claim financial buyers at provider organizations need to move a purchase forward. Campaign volume is high. Coverage isn’t.
That changes what you do next. Instead of asking for more assets, you ask which missing persona, underserved segment, or unsupported claim creates the most go-to-market risk right now.
Our analysis shows most marketing teams have about 10 to 30% content coverage against the revenue plan, and can’t see where they’re exposed. That isn’t an asset volume problem. It’s an unmeasured segment gap.
How does competitive intelligence show where your positioning is exposed?
Competitive marketing intelligence shows where your positioning wins and loses the buyer conversation against named competitors. In B2B, competitive positioning is the case you make for why a specific buyer should choose you over the alternatives, and it only works if it reaches that buyer: the right persona, at the funnel stage where they compare options.
Map the same dimensions against your category competitors and the heatmap shows you:
- Where a competitor dominates the category conversation at a specific funnel stage
- Where competitor coverage is thin, inconsistent, or missing entirely
- Which buyer personas the whole category leaves unaddressed
In crowded categories like legal tech, insurtech, fintech, and horizontal SaaS, that last finding is the most actionable. An unaddressed persona is a gap in the category conversation your positioning can claim before anyone else does. You can scan a competitor’s content coverage the same way you map your own, which turns competitor messaging analysis into a list of openings rather than a slide of logos.
When should you review positioning coverage?
Review coverage on a schedule, not when something breaks. Four moments matter most:
- Before every product or campaign launch, review coverage against the personas and segments the launch is meant to reach.
- After any positioning pivot, map which shipped assets still carry the old language.
- During quarterly planning, find the segments with low inheritance across every funnel stage.
- When pipeline quality diverges from campaign performance, trace the divergence to the coverage layer before you diagnose demand gen or sales execution.
Measured this way, positioning impact isn’t volume produced or attribution claimed. It’s observable inheritance across the market conversations you’ve chosen to compete in.
What changes when you measure positioning, not just performance?
You stop asking only “what performed?” and start asking “where did our positioning reach the market?” The first question is easy because performance is measurable. The second decides whether the next launch beats the last one, and most teams have had no way to see it.
When you can trace inheritance from approved positioning through shipped assets, then see that trace as a coverage map by persona, segment, and competitive context, you’re working with a different kind of evidence. You can catch positioning drift before it hits revenue. You can put investment behind the segments your sales team is actually pursuing. And you can show, precisely, where the strategy landed and where it didn’t.
The campaigns that left priority segments uncovered weren’t failures of execution. They were unmeasured segment gaps. When it all starts from an encoded messaging foundation and gets reviewed by persona coverage instead of channel performance, you can find the missing narratives and direct investment to the exact funnel stages where sales needs support.
Frequently asked questions
How do we measure the real impact of our positioning, not just campaign performance?
Measure positioning inheritance: map every shipped asset to the persona, segment, funnel stage, and message pillar it serves, and check that it carries the approved positioning. Campaign analytics confirm delivery and response. Only inheritance tracking shows whether your narrative reached the right buyers intact.
What is competitive positioning in B2B?
Competitive positioning in B2B is the case you make for why a specific buyer should choose you over the alternatives. It’s measured by whether that case reaches the right persona at the stage where they compare options, not by whether it appears in a positioning doc.
What is a coverage heatmap, and how does it improve B2B marketing analytics?
A coverage heatmap shows which personas, segments, and funnel stages your content covers and where it leaves you exposed. It turns asset-level data into a decision surface, so you can see where your positioning is absent before it affects win rates or revenue.
Why can’t standard campaign analytics show whether our positioning reached the intended personas?
Campaign analytics aggregate at the channel and asset level, while positioning drift accumulates at the persona, segment, and message-pillar level. Dashboards can show performance, but they can’t confirm the approved narrative survived adaptation across channels, regions, or AI-generated derivatives.
How do we identify and close coverage gaps in our go-to-market strategy?
Map shipped assets against the personas, segments, and funnel stages they address, then view that data as a heatmap. The gaps become visible, so you can direct investment and corrective work before they show up in sales or win-rate reports.
What risks do we face if we only measure asset delivery and not positioning inheritance?
You optimize for visible activity while positioning drift goes unmeasured. Priority segments stay uncovered or misrepresented, competitors take the conversations you left open, and the blind spots only surface after pipeline or revenue suffers.