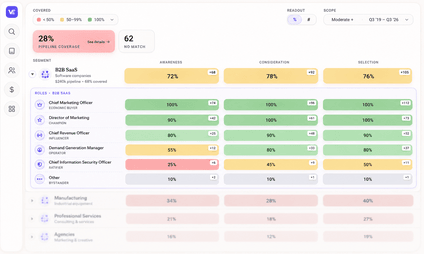
Your campaign calendar closed. Which priority segments can you defend at the next pipeline review? A calendar shows what shipped; a coverage heatmap shows whether each segment has usable demand generation content at every funnel stage.
TL;DR
- A campaign calendar records what shipped. It can’t tell you whether each priority segment has the right demand generation content at every funnel stage.
- Build a coverage heatmap with segments as rows and funnel stages as columns, then judge every cell against six criteria, not just whether an asset exists.
- Walk into the pipeline review with a risk map and a production sequence, not a launch list.
The campaign calendar closed. Programs shipped across every priority segment. You walked into the pipeline review with a launch list, an activation summary, and a dashboard showing rising traffic, keyword rankings, and intent signals.
Those metrics signal momentum until the CRO asks which segments can sustain pipeline through next quarter.
Traffic and intent signals don’t answer that question. Neither does the campaign calendar. When pipeline pressure arrives without a coverage model behind it, your demand engine becomes indefensible at the exact moment leadership needs a number.
Why isn’t a campaign calendar enough to prove funnel coverage?
A campaign calendar records production decisions, not coverage. It tells you what shipped, while coverage tells you whether the right funnel-stage asset exists for the right persona in the right segment.
The usual demand generation metrics don’t close that gap. Keyword rankings and traffic tell you who looked. Neither tells you whether a fintech director evaluating your category has a reason to move past awareness. Or whether the healthtech economic buyer your sales team is working has a late-stage validation asset that reflects her buying criteria. Or whether the HR tech evaluator who entered the funnel three weeks ago has seen anything besides a recycled top-of-funnel blog.
Coverage means the asset is also built around the message guardrails that make it usable in a live sales cycle. That’s what a covered funnel looks like, and it’s a different measure from output.
Teams confuse production with coverage because the calendar closes cleanly and traffic trends upward. Four programs launched. Boxes checked. The planning loop closes before anyone raises the coverage question.
The sharper failure in B2B SaaS isn’t too little content. It’s misallocated content:
- Assets exist for the segment, but all of them are awareness-stage.
- Consideration and late-stage validation are exposed for the personas carrying pipeline risk.
- Sales inherits the gap and absorbs it as a support request your team can’t answer quickly.
Our analysis shows most marketing teams have about 10 to 30% content coverage against the revenue plan for the buyers it depends on, and can’t see where they’re exposed.
A campaign asset built on a horizontal theme and deployed into a vertical segment with its own buying committee and procurement cycle isn’t coverage. It’s occupancy. The cell is filled, but the buyer has no reason to move.
What you need isn’t faster production or more search visibility. It’s a model that connects assets to the buyer situations they’re meant to address.
How do you build a coverage heatmap for demand generation content?
Build it around pipeline risk: priority segments as rows, funnel stages as columns, and each cell judged on whether a usable asset exists for that intersection. An asset inventory, a spreadsheet of what exists by format or campaign name, isn’t a coverage model. It’s a catalog, which is the difference between content inventory and content coverage.
The minimum viable coverage heatmap for demand generation:
- Rows are priority segments, ranked by pipeline value and sales urgency: fintech, healthtech, insurtech, legal tech, and HR tech. Your B2B market segmentation decides the rows, and segments with no content support show up as empty ones.
- Columns are funnel stages: top-of-funnel category visibility, consideration, late-stage validation, sales enablement, and expansion.
- Each cell asks whether a usable, current, persona-specific asset exists for that intersection, not whether any asset exists.
That distinction matters. Generic or stale assets adapted across segments make cells look populated without covering them. A consideration asset written for a VP of Operations at a horizontal SaaS company doesn’t cover a VP of Legal at a legal tech firm working through procurement and IT security requirements.
VelocityEngine’s Content Coverage Heatmap scores your content by segment, persona, and funnel stage. Drill into a cell and you see the assets behind it, which is where the six criteria below come in.
What criteria should you use to score demand generation content?
Judge every asset in a cell against six criteria. An asset that fails them doesn’t count toward coverage, even if it fills the cell.
- Buying committee relevance: Does it address the actual decision-maker or evaluator in this segment?
- Stage fit: Is it built for the conversion path it’s supposed to support?
- Message inheritance: Does it reflect the positioning guardrails for this ICP segment?
- Freshness: Are the market context, competitive framing, and product references current?
- Sales usability: Can a rep use it in a live cycle without modification or apology?
- Conversion path: Does it give the buyer a clear next step, or does it end without direction?
Consider a legal tech pipeline where the general counsel persona has strong top-of-funnel coverage. The heatmap looks healthy at the top. Then the review reaches late-stage validation for procurement and IT security, and those cells are empty. The buying committee is real, the sales motion needs validation assets for those personas, and nothing exists for that intersection. The calendar never surfaced the gap because programs launched on schedule. The heatmap surfaces it in a single row.
The heatmap forces prioritization. You decide which gaps get production capacity, which assets can be adapted with a targeted rewrite, and which incoming requests to decline because higher-priority gaps are still open.
How does a coverage heatmap help you defend your demand generation plan?
It replaces a launch list with a risk map. Instead of reporting what shipped, you show which segments are covered at which stages, where the gaps are, and the sequence to close them.
The weak defense: “We have campaigns live across all five priority segments.”
The stronger defense: “Fintech and healthtech are covered through consideration. Insurtech and legal tech are exposed at late-stage validation, and HR tech has nothing past top of funnel. Here is the production sequence to close those gaps before next quarter’s pipeline review.”
The second version holds up because it ties demand generation activity to the buyer situations it’s meant to address. It shows coverage cell by cell, with gaps visible and fixes sequenced.
A weekly coverage review is the demand generation framework that keeps it current:
- Review the campaign assets shipped the prior week.
- Rescore the affected segment-stage cells against the six criteria.
- Find coverage regressions, where new content replaced a stale asset but opened a gap in an adjacent stage or persona.
- Flag cells where pipeline targets went up but coverage didn’t.
- Connect the remaining gaps to the specific sales conversations they put at risk.
That routine keeps you ahead of the conversation. When the CRO raises a gap in healthtech late-stage validation, you can show the gap, the timeline to close it, and what exists as a bridge. You don’t debate the anecdote or ship a one-off asset that doesn’t inherit positioning.
Trade-offs across segment priority, sales urgency, funnel stage, and production capacity exist whether or not you map them. The heatmap puts them in the open, where leadership can see them and allocate accordingly.
What should you ask before your next pipeline review?
Ask which priority segment-stage intersection is under-served, what the specific gap is, and how long it will take to close. The campaign calendar was never the problem. Treating it, along with traffic and intent signals, as proof that the funnel is covered is.
Coverage is a structural claim. It holds or it doesn’t, segment by segment, persona by persona, stage by stage. Only a model that maps what exists against what each buyer situation requires can answer it. That’s what turns a B2B demand generation strategy into a position you can defend when pipeline pressure calls for a number, not a story.
If you lead demand gen, start with the content gaps your role sees first, and take coverage to the board once it holds. Build the map before leadership builds it for you.
Frequently asked questions
How does a coverage heatmap improve funnel coverage for B2B demand generation?
A coverage heatmap lays your content over priority segments, personas, and funnel stages so you can see which intersections are covered and which are exposed. Judging each cell against six criteria (buying committee relevance, stage fit, message inheritance, freshness, sales usability, and conversion path) shows gaps that campaign calendars and asset inventories miss.
Why isn’t a campaign calendar enough to ensure funnel coverage?
A campaign calendar records production activity. It doesn’t measure whether the right asset exists for the right persona at the right funnel stage in each segment. Only a coverage model shows the gaps that put pipeline at risk, so you can fix them before leadership asks.
What criteria should we use to score demand generation content?
Use six criteria: buying committee relevance, stage fit, message inheritance, freshness, sales usability, and conversion path. Together they confirm each asset reaches the right decision-maker, fits its stage, carries the segment’s positioning, is current, works in a live sales cycle, and gives the buyer a next step.
How can we identify and prioritize coverage gaps before a pipeline review?
Map your assets to a heatmap by segment and funnel stage, then judge each cell against the six criteria. The under-served intersections become visible, you can tie each gap to a specific sales risk, and you can sequence production before the review.
What is the difference between an asset inventory and a coverage model?
An asset inventory catalogs existing content by format or campaign. A coverage model checks whether a usable, current, persona-specific asset exists for each priority segment and funnel stage, so you prioritize by pipeline risk instead of production history.