TL;DR
- Most content budgets are approved against an inventory of what exists, by format and owner. An inventory can't tell you which buyers in the revenue plan have content that serves them.
- A content gap needs a diagnosis before it gets a budget line, and gaps come in 3 categories.
- True whitespace needs new content, saturation needs consolidation, and stale positioning needs a refresh.
- A content coverage heatmap sorts the first 2 categories on its own and flags candidates for the third. With marketing budgets essentially flat, a request tied to named, categorized gaps is the business case a CFO can approve.
Try this before your next budget review. Name the 3 segments your revenue strategy leans on hardest this quarter. Then, for each, name the buyers and funnel stages where you have current, credible content right now.
If answering takes a spreadsheet, a message to the content manager, or a guess, your budget is running on content library logic. It is being approved against what exists, and nobody has checked who that content serves.
CMOs feel this most when money is tight, and it is. Gartner's 2026 CMO Spend Survey found marketing budgets increased from only 7.7% to 7.8% of company revenue in 2025, and Gartner expects that to push CMOs toward sharper budget prioritization and reallocation.
A budget request that says "we need more content" is hard to defend without the intel to back it up, but a request that comes with a business case to identify the gaps, say what kind they are, and price the fix is much easier to approve.
Every content gap needs a diagnosis before it gets a budget line.
Content inventory logic versus content coverage logic
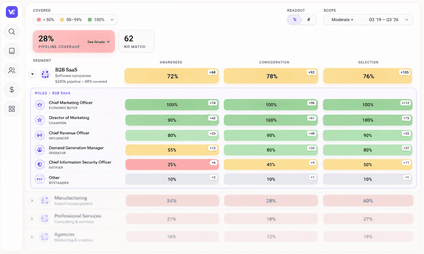
A content library organizes assets by how marketing works: format, campaign, owner, and channel. A content coverage heatmap organizes them by how the company sells: segment, buyer, and funnel stage.
The two views can tell opposite stories about the same content library.
For example, if a mid-market, sales-led software company had 80 assets aligned to enterprise expansion, the content library would look healthy. But, what if, mapped by buyer, most of those assets landed on the IT evaluator while the economic buyer had almost nothing?
Enterprise deals have many stakeholders that make up the buying committee. Forrester's 2026 buyer research puts the typical B2B purchase at 13 internal stakeholders and 9 external influencers. A content library counts assets, but it can't tell you how many of those buyers have content specifically written for them.
VelocityEngine’s Content Coverage Heatmap makes that knowable. It assigns each asset to the one segment, buyer, and stage it serves best, and counts it only there. That is how "80 enterprise assets" becomes "2 of the 5 enterprise buyers you defined."
The 3 content gaps for B2B marketing teams
Thin content coverage on a heatmap is a decision point. Before anyone approves spend, sort the gaps into 3 categories, because each calls for a different fix.
- Whitespace: Your plan counts on a buyer and stage, and you have nothing credible written for them. When a competitor is already speaking to that buyer, the whitespace is contested, and the buyer is reading someone else's framing. When nobody is, it's open, and the first credible piece sets the terms. Both call for new production, and this is the only kind that does.
- Saturation: Several assets say the same thing to the same buyer while the neighboring cells stay thin. Consolidate, retire the extras, and move the budget next door.
- Stale positioning: The asset exists, but it argues a story you no longer tell: an old category, an old product motion, or last year's objections. Refresh it before commissioning a replacement.
Here's how that plays out.
> Sales asks for more fintech content
> Marketing points to 12 existing assets
> A review finds that 9 use compliance language the company has since retired
> 2 sit in a resource center that reps never open, and 1 is aimed at the wrong member of the buying committee.
The request sounded like whitespace, but it was really 9 refreshes, 2 assets that never reached reps, and 1 retarget, and a budget for new content would have fixed none of them.
Your team will spend longer categorizing gaps than approving a brief. It also means telling sales that some of their requests will be answered with a refreshed asset.
What the content map sorts, and what your team checks
The heatmap handles 2 of the 3 sorts on its own. Cells that fall short of their plan-derived target, with nothing strong in them, are true whitespace. Run the same map on the competitors you meet in deals, using your taxonomy, and each whitespace cell shows whether it's contested or open. Cells past their ceiling, or segments where most assets land on 1 buyer, point to saturation.
Choose those competitors carefully. A category giant with 10 times your library will fill every cell and tell you nothing, so compare against the vendors you actually come up against.
It also flags candidates for the third category. The heatmap discounts content older than 6 months, and more so past a year, so an aging cell shows you where to look for stale positioning. Whether the argument itself has gone out of date is a call for your product marketing team.
A budget conversation built on content gaps
Once every cell with thin coverage has been categorized, the budget request has 4 lines: build, consolidate, refresh, and leave alone.
"Leave alone" is the line most requests are missing. The map marks cells already past their target, so you can show where spending stops as well as where it starts. Few budget requests include that line, and it lends credibility to everything else in the request.
The map also weights coverage by the segments the plan prioritizes. A whitespace cell in the enterprise segment that carries most of the plan outranks 6 in a mature segment that already converts.
"If you've got 87 gaps and only so many hours in the day, the heat map would be super valuable as a pressure point. It would impress on leadership that we don't have the team to address those right now."
That is the other use of a categorized heatmap. It shows leadership what the current team can't cover, in terms they can decide on, which is the kind of number boards are starting to ask marketing for.
Expect the heatmap to show a content library more concentrated than you believed, and some of that concentration will trace back to your own past spend.
For the gaps categorized as whitespace or stale positioning, the Campaign Operating System builds or refreshes the content from one governed foundation. New and refreshed assets carry your current positioning from the first draft.
Identify your gaps and build a business case for budget. Run a free coverage scan on your website.
Run my free content coverage map
Frequently asked questions
Can a content audit identify content gaps?
An audit shows what exists, by format, topic, date, and owner. It can reveal missing formats or topics, but not missing buyers, because it isn't organized around who the content serves. Mapping each asset to the buyer, segment, and stage it serves best turns an inventory into a gap list.
How do you find saturated content?
Count each asset once, in the cell it serves best. Cells where many assets pile up become visible, as do segments where most content lands on 1 buyer. Once a cell passes its target, a coverage map shows it as a surplus, which is where consolidation starts.