TL;DR
- GTM alignment fails when sales, marketing, product, and customer success share a number but not a picture of the buyer.
- The fix is one shared buyer's journey map: pain points, stages, influences, and barriers for every member of the buying committee.
- Map it in 5 steps, then check it against what you have published. That check turns predicted gaps into a list someone can act on.
What is GTM alignment?
GTM alignment is when sales, marketing, product, and customer success work from the same view of who the buyer is, what that buyer needs at each stage, and who owns each stage. Shared KPIs are part of it, but they are not the cause of it.
When go-to-market (GTM) teams fail to align, the usual diagnosis is the scorecard. Leaders assume the fix is agreeing on shared key performance indicators (KPIs), metrics, or incentives.
Why don't shared KPIs align GTM teams?
Shared KPIs tell every team which number to hit. They don't tell anyone which buyer has to be persuaded, what that buyer needs to understand, or whether anything has been written for them.
Two teams can share the same pipeline target and still tell different stories, chase different buyers, and leave the same questions unanswered. GTM teams align when they share one picture of the buyer's journey.
For a CMO, that raises a question analytics can't answer: whether anything was written for the buyers, segments, and funnel stages the revenue plan depends on. This post covers how to map the buyer's journey, where mapping usually breaks down, and what changes once the map is checked against what you have published.
What is the buyer's journey in B2B SaaS?
The buyer's journey is the path a buying committee takes from naming a problem to solving it with your product, and then to renewing, expanding, and recommending you. In B2B SaaS the committee spans several functions, and each person brings different concerns to the decision. (For the difference between a persona and a seat on that committee, see how B2B personas differ from buying roles.)
Mapping the buyer's journey means answering 4 questions for each buyer:
- Pain points. Which challenge or job to be done starts the search?
- Stages. What steps does the buyer take to evaluate and decide?
- Influences. Which sources, people, and conversations shape the decision?
- Barriers. Which objections or risks have to be answered?
Why does a shared buyer's journey map matter?
Without a shared map, each team reads its role differently. One optimizes for leads, another for late-stage objections, another for product adoption. Each can hit its own target while nobody can see whether the whole buying committee has been addressed.
- One picture of the customer. A mapped journey gives sales, marketing, product, and customer success the same reference point. VelocityEngine holds that reference in one governed foundation of messaging, positioning, personas, and segment definitions that every campaign starts from.
- Consistent messaging. When teams disagree about a buyer's priorities, a sales call and a campaign make different arguments to the same person. When everyone writes from the same map and the same approved messaging, the rep and the campaign make the same case. It's the problem behind when marketing and sales read different maps.
- Sharper positioning. Mapping forces decisions: how the product answers each pain point, which features matter at which stage, how to frame the problem, and how you differ from the other vendor in the deal. The Content Coverage Heatmap helps by mapping a competitor's content onto your own segments and buyers, cell by cell.
- Clear ownership. Each function moves the buyer through different stages. Writing down who owns which stage ends the argument about whose job a given asset is.
The cost is time. A usable map takes working sessions across 4 functions, and someone has to own keeping it current.
How do you align GTM teams around the buyer's journey?
Align GTM teams in 5 steps: define the journey stages, name each buyer's pain points per stage, assign an owner to each stage, plan content for each buyer and stage, and review the map every quarter.
Step 1. Define the journey stages
- Awareness and education. The buyer names a business problem and learns what kinds of solutions exist.
- Consideration. The buyer compares specific options, including your competitors.
- Selection. The buyer chooses a solution and wins agreement from the rest of the committee.
- Onboarding. The customer starts using the product and judges its early impact.
- Renewal. The customer has the result they bought for, and renews.
- Expansion. The customer adds products or teams and widens the impact.
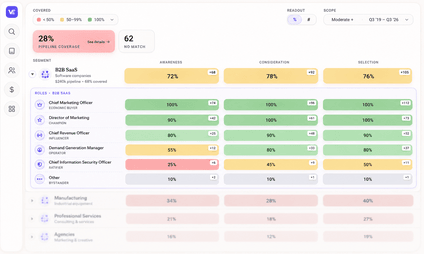
The first 3 stages are where the deal is decided, and they are the stages the Content Coverage Heatmap measures. The Campaign Operating System plans campaigns across all 6, from first touch through expansion.
Step 2. Name pain points and jobs to be done
At each stage, write down the challenge the buyer faces, the job they need done to move forward, and the risk that makes them hesitate.
This is where most maps stay theoretical. The Content Coverage Heatmap checks the map against what you have published. It assigns each asset to the one segment, buyer, and stage it serves best and counts only strong matches. The result shows which buyers have nothing strong written for them, and every cell opens to the assets behind the number, so any call can be checked. (More on finding content gaps by persona.)
Expect a less flattering picture than your content count suggests. A large library usually sits in fewer cells than the team expected.
Step 3. Assign roles at each stage
- Marketing. Frames the problem, builds awareness, and educates the committee.
- Sales. Builds relationships, answers objections, and makes the difference from competitors clear.
- Product. Shows the features that answer the pain points that matter most.
- Customer success. Gets customers to the result they bought for and turns them into advocates.
The Campaign Operating System turns these roles into campaign briefs with a named owner, so everyone can see who is building what, for which stage.
Step 4. Plan content for each buyer and stage
For each buyer and stage, decide which formats carry the argument. Typical choices:
- Awareness and education. Problem-focused blog posts, thought leadership, and industry trend eBooks.
- Consideration. Comparison guides, industry eBooks, and case studies showing how others solved the same problem.
- Selection. ROI calculators, one-pagers, tailored demos, account pages, and objection guides.
- Onboarding. Onboarding guides, training videos, FAQs, quick-start tutorials, and implementation checklists.
- Renewal. Impact reports, performance dashboards, and case studies with measured results.
- Expansion. Expansion playbooks, advanced use-case guides, customer stories, and product showcase webinars.
The Campaign Operating System builds these in a campaign workspace where each asset stays linked to the strategy, promotion, and sales enablement it belongs to. The trade-off is setup: the shared foundation has to be written properly first, and that is real work. For a worked example by stage, see what a covered funnel looks like.
Step 5. Review the map every quarter
Buyers change, competitors publish, and content ages. Re-running the Content Coverage Heatmap shows what moved since the last run, what a competitor added, and which covered cells rest on content old enough to be losing standing. A map nobody revisits describes last year's buyer.
Where does buyer's journey mapping break down?
Most buyer's journey maps fail in one of 4 ways.
- Internal goals instead of buyer needs. A journey map should describe what the buyer goes through. KPIs still matter, but they can't show the buyer or stage nobody planned content for.
- One buyer standing in for the committee. B2B decisions involve several people with different concerns. A map written for one of them leaves the others without an answer.
- One generic map. Segments buy differently, so industries, roles, and use cases each need their own version. The Content Coverage Heatmap's segments and buyers are editable, and every edit is saved as a version you can compare.
- Stopping at the signature. Onboarding, renewal, and expansion are part of the journey. Leaving them out leaves customer success without the content it needs to keep and grow the account.
What changes when GTM teams align around the buyer?
The first thing that changes is how teams decide what to build. The revenue effect takes longer to show, and you should measure it in your own systems.
- Content decisions made on evidence. Instead of choosing what to write next from last quarter's top performers, the team works from a list of buyers and stages with nothing strong written for them, weighted by the segments that carry the revenue plan. (See scoring content against the revenue plan.)
- Like-for-like competitive positioning. Mapping a competitor's content onto your own taxonomy shows where they address a buyer you don't, so positioning work starts from a specific gap. A competitive coverage scan runs the same map on the competitors you name.
- Continuity after the sale. Campaigns planned across all 6 stages, with variations by buyer, channel, segment, and region, carry the same argument from first touch through expansion.
- Less rework. Briefs start from the shared foundation instead of a blank page, and campaign status, asset readiness, and ownership sit in one place instead of in status meetings.
One limit, stated plainly: the Content Coverage Heatmap does not read performance data. It shows what exists and who it serves, not how that content performed, so connecting coverage to engagement, conversion, or pipeline happens in your own analytics. For the other half of that picture, see what performance data doesn't show.
Final thoughts
Metrics define the target. A shared map of the buyer defines the work it takes to reach it. Without one, every team can hit its own activity goal while buyers the plan depends on have nothing written for them.
Start by mapping the journey with all 4 functions in the room. Then check it against what you have published, because that is where the map's predicted gaps become a list someone can act on.
See who your content reaches
A coverage scan maps your published content against the buyers, segments, and funnel stages your revenue plan depends on. Each asset counts once, in the single cell it serves best, so the gaps you see are real rather than inflated.
Frequently asked questions
What is GTM alignment?
GTM alignment is when sales, marketing, product, and customer success share one view of the buyer: who is on the buying committee, what each member needs at each stage, and which team owns each stage. Shared KPIs support it but don't create it.
What is the biggest challenge in aligning GTM teams?
The biggest challenge is usually a missing shared view of the buyer's journey. Teams focus on internal KPIs, which confirm the goal but can't show the buyer nobody wrote for, the stage with no strong content, or the objection nobody answered.
How do you create a buyer's journey map for B2B SaaS?
Create a buyer's journey map by defining the stages from awareness through expansion, then recording each buying committee member's pain points, influences, and barriers at every stage. Assign an owning team to each stage, plan content per buyer and stage, and review the map quarterly.
How do you know if your content covers every buyer and stage?
Lay your published content over the map as a grid of segment, buyer, and stage, and count only strong matches. The empty cells are your gaps. VelocityEngine's Content Coverage Heatmap does this by assigning each asset to the one cell it serves best.
How does VelocityEngine help with GTM alignment?
VelocityEngine shows whether your content reaches the buyers, segments, and funnel stages your revenue plan depends on, then builds what is missing. The Content Coverage Heatmap scores published content against those cells, and the Campaign Operating System builds on-brand content to close the gaps from one governed foundation.
Why is a buyer-centric approach important for B2B SaaS companies?
B2B SaaS deals are decided by a buying committee, and each member needs a different argument at a different stage. A buyer-centric approach keeps messaging relevant to each of them and gives every GTM team one view of who the revenue plan depends on.
How does mapping the buyer's journey improve team efficiency?
Teams with a mapped journey know which function owns each stage, so they stop duplicating work or arguing about whose job an asset is. In VelocityEngine, the Campaign Operating System turns that into structured briefs and shows status, readiness, owners, and dependencies in one place.